Python Filled Chord Diagram

Hi. I am trying to find a way to customize more the above type of chart. (>>> plot.ly/python/filled-chord-diagram/)
What I would like to add is outer labels and outer thick marks. So I would like a combination of these 2 examples :


Any ideas? I thought maybe to change some parameters from layout function but I`m not very familiar with all of them.

Thank you,
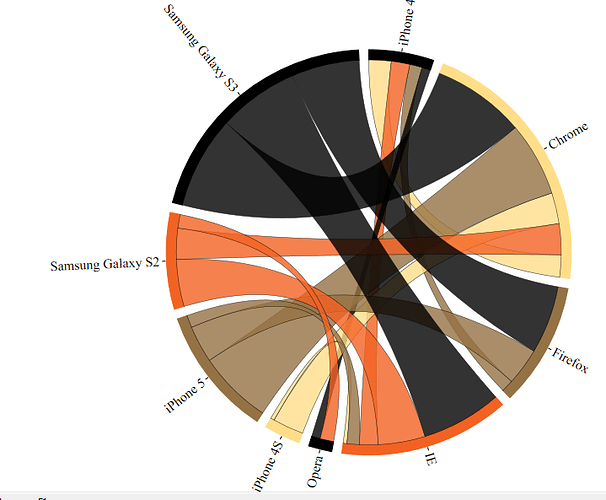
@nickdragosh Here you have an example on how to insert radial labels: https://plot.ly/~empet/14007. To add outer radial ticks you should add a new trace to the plot, containing radially directed short line segments. Beware that in Plotly clockwise angles with the horizontal line (Ox) are positive and counter-clockwise are negative.