Preserve updatemenus dropdown selection on update?

Hi,

Is there any way you can preserve the state of updatemenus dropdown selection, so when the graph updates, I still retain my selection?


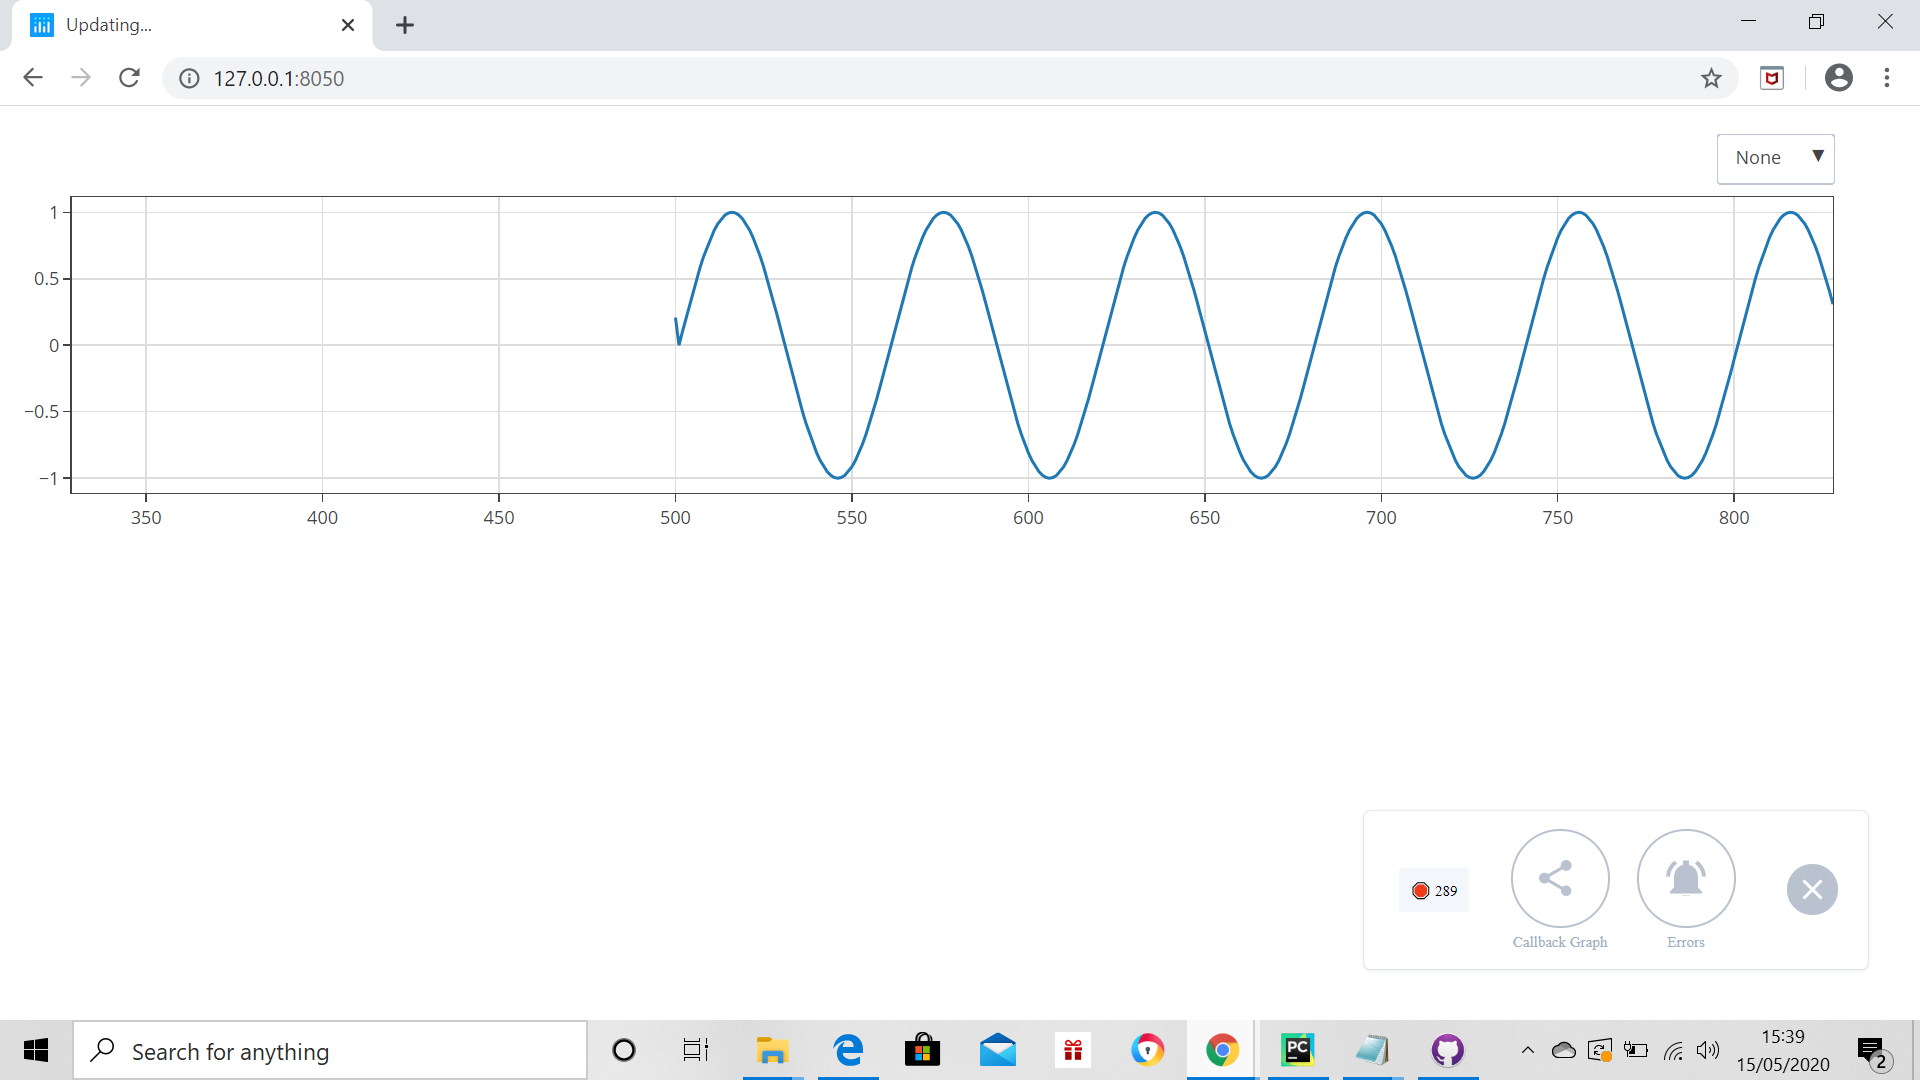
Default visible trace.


So, when I select another option from updatemenus dropdown, on update it should remain the same, instead of going back to default.

My code:

import numpy as np
from collections import deque
import dash
import dash_core_components as dcc
import dash_html_components as html
import plotly.graph_objs as go
from dash.dependencies import Output, Input

trace_names = ['Sine', 'Cosine']
freq = 60
ws = 500

X1 = deque(maxlen=ws)
Y1 = deque(maxlen=ws)
Y2 = deque(maxlen=ws)

for i in range(1, ws):
    X1.append(i)
    Y1.append(None)
    Y2.append(None)

app = dash.Dash(__name__)
app.layout = html.Div([
    dcc.Graph(id='live-graph', clear_on_unhover=True, config={'displayModeBar': False}, className=''),
    dcc.Interval(
        id='interval',
        interval=1*1000,
        n_intervals=0
    )],
    className = 'row'
)


@app.callback(Output('live-graph', 'figure'),
             [Input('interval', 'n_intervals')])
def update_graph_scatter(n):
    X1.append(X1[-1]+1)
    Y1.append(np.sin(2*np.pi/freq*n))
    Y2.append(np.cos(2*np.pi/freq*n)/2)

    data = []
    data.append(go.Scatter(x=list(X1), y=list(Y1), name=trace_names[0], mode= 'lines', hovertemplate='y: %{y:.2f}'))
    data.append(go.Scatter(x=list(X1), y=list(Y2), name=trace_names[1], mode= 'lines', visible=False, line={'dash': 'dot'}, hovertemplate='y: %{y:.2f}'))

    layout = go.Layout(
        height=300,
        xaxis={'visible': True, 'mirror': True, 'ticks': 'outside', 'showline': True, 'gridcolor': '#ddd', 'zeroline': False},
        yaxis={'mirror': True, 'ticks': 'outside', 'showline': True, 'visible': True, 'gridcolor': '#ddd', 'zeroline': False},

        margin={'l': 40, 'b': 50, 't': 10, 'r': 50},
        legend={'font': {'size': 15}, 'orientation': 'h', 'xanchor': 'right',
                'yanchor': 'bottom',
                'x': 0.91, 'y': 1.02, 'itemdoubleclick': False, 'uirevision': True},
        uirevision=True,
        clickmode='none',
        updatemenus=[
            dict(
                active=0,
                x=1,
                xanchor="right",
                y=1.22,
                yanchor="top",
                buttons=list([
                    dict(label="None",
                         method="update",
                         args=[{"visible": [True, False]},
                               {'title': {'text': '{} {}'.format('',''), 'font': {
                                   'color': 'black', 'size': 15}, 'x': 0.06,
                                          'xanchor': 'left', 'y': 0.85,
                                          'yanchor': 'top'},}]),

                    dict(label="Cosine",
                         method="update",
                         args=[{"visible": [False, True]},
                               {'title': {'text': '{} {}'.format('', ''), 'font': {
                                   'color': 'black', 'size': 15}, 'x': 0.06,
                                          'xanchor': 'left', 'y': 0.85,
                                          'yanchor': 'top'},
                                "annotations": []}]),
                    dict(label="All",
                         method="update",
                         args=[{"visible": [True, True]},
                               {'title': {'text': '{} {}'.format('', ''), 'font': {
                                   'color': 'black', 'size': 15}, 'x': 0.06,
                                          'xanchor': 'left', 'y': 0.85,
                                          'yanchor': 'top'},
                                "annotations": []}]),
                ])
            )
        ],
        annotations=[{
            'font': {'size': 15},
            'visible': True,
            'text': f'<b> title </b>',
            'x': 0,
            'y': 1.02,
            'xanchor': 'left',
            'yanchor': 'bottom',
            'xref': 'paper',
            'yref': 'paper',
            'showarrow': False,
        }],
    )

    return {'data': data,'layout' : layout}


if __name__ == '__main__':
    app.run_server(debug=True)

Regards

Hi @ali123 welcome to the forum! Yes it seems that changing the updatemenus buttons does not persist even when setting uirevision (probably because it’s a change of traces and not of the layout, and uirevision is for tracking layout changes such as zoom etc.). What you can do though is to update the extendData property of the dcc.Graph instead of changing the whole figure, as in the code below.

import numpy as np
from collections import deque
import dash
import dash_core_components as dcc
import dash_html_components as html
import plotly.graph_objs as go
from dash.dependencies import Output, Input
import json

trace_names = ['Sine', 'Cosine']
freq = 60
ws = 500

X1 = deque(maxlen=ws)
Y1 = deque(maxlen=ws)
Y2 = deque(maxlen=ws)

for i in range(1, ws):
    X1.append(i)
    Y1.append(None)
    Y2.append(None)


fig = go.Figure()
fig.add_trace(go.Scatter(x=[], y=[], name=trace_names[0], mode= 'lines', hovertemplate='y: %{y:.2f}'))
fig.add_trace(go.Scatter(x=[], y=[], name=trace_names[1], mode= 'lines', visible=False, line={'dash': 'dot'}, hovertemplate='y: %{y:.2f}'))

fig.update_layout(uirevision='persist')
fig.update_layout(
        height=300,
        xaxis={'visible': True, 'mirror': True, 'ticks': 'outside', 'showline': True, 'gridcolor': '#ddd', 'zeroline': False},
        yaxis={'mirror': True, 'ticks': 'outside', 'showline': True, 'visible': True, 'gridcolor': '#ddd', 'zeroline': False},

        margin={'l': 40, 'b': 50, 't': 10, 'r': 50},
        legend={'font': {'size': 15}, 'orientation': 'h', 'xanchor': 'right',
                'yanchor': 'bottom',
                'x': 0.91, 'y': 1.02, 'itemdoubleclick': False, 'uirevision': True},
        uirevision='persist',
        clickmode='none',
        updatemenus=[
            dict(
                active=0,
                x=1,
                xanchor="right",
                y=1.22,
                yanchor="top",
                buttons=list([
                    dict(label="None",
                         method="update",
                         args=[{"visible": [True, False]},
                               {'title': {'text': '{} {}'.format('',''), 'font': {
                                   'color': 'black', 'size': 15}, 'x': 0.06,
                                          'xanchor': 'left', 'y': 0.85,
                                          'yanchor': 'top'},}]),

                    dict(label="Cosine",
                         method="update",
                         args=[{"visible": [False, True]},
                               {'title': {'text': '{} {}'.format('', ''), 'font': {
                                   'color': 'black', 'size': 15}, 'x': 0.06,
                                          'xanchor': 'left', 'y': 0.85,
                                          'yanchor': 'top'},
                                "annotations": []}]),
                    dict(label="All",
                         method="update",
                         args=[{"visible": [True, True]},
                               {'title': {'text': '{} {}'.format('', ''), 'font': {
                                   'color': 'black', 'size': 15}, 'x': 0.06,
                                          'xanchor': 'left', 'y': 0.85,
                                          'yanchor': 'top'},
                                "annotations": []}]),
                ])
            )
        ],
        annotations=[{
            'font': {'size': 15},
            'visible': True,
            'text': f'<b> title </b>',
            'x': 0,
            'y': 1.02,
            'xanchor': 'left',
            'yanchor': 'bottom',
            'xref': 'paper',
            'yref': 'paper',
            'showarrow': False,
        }],
    )


app = dash.Dash(__name__)
app.layout = html.Div([
    dcc.Graph(id='live-graph', clear_on_unhover=True, config={'displayModeBar': False}, className='', figure=fig),
    dcc.Interval(
        id='interval',
        interval=1*1000,
        n_intervals=0
    ),
    className = 'row'
)


@app.callback(Output('live-graph', 'extendData'),
             [Input('interval', 'n_intervals')])
def update_graph_scatter(n):
    X1.append(X1[-1]+1)
    Y1.append(np.sin(2*np.pi/freq*n))
    Y2.append(np.cos(2*np.pi/freq*n)/2)

    return [dict(x=[[X1[-1]], [X1[-1]]], y=[[Y1[-1]], [Y2[-1]]]), [0, 1]]


if __name__ == '__main__':
    app.run_server(debug=True)