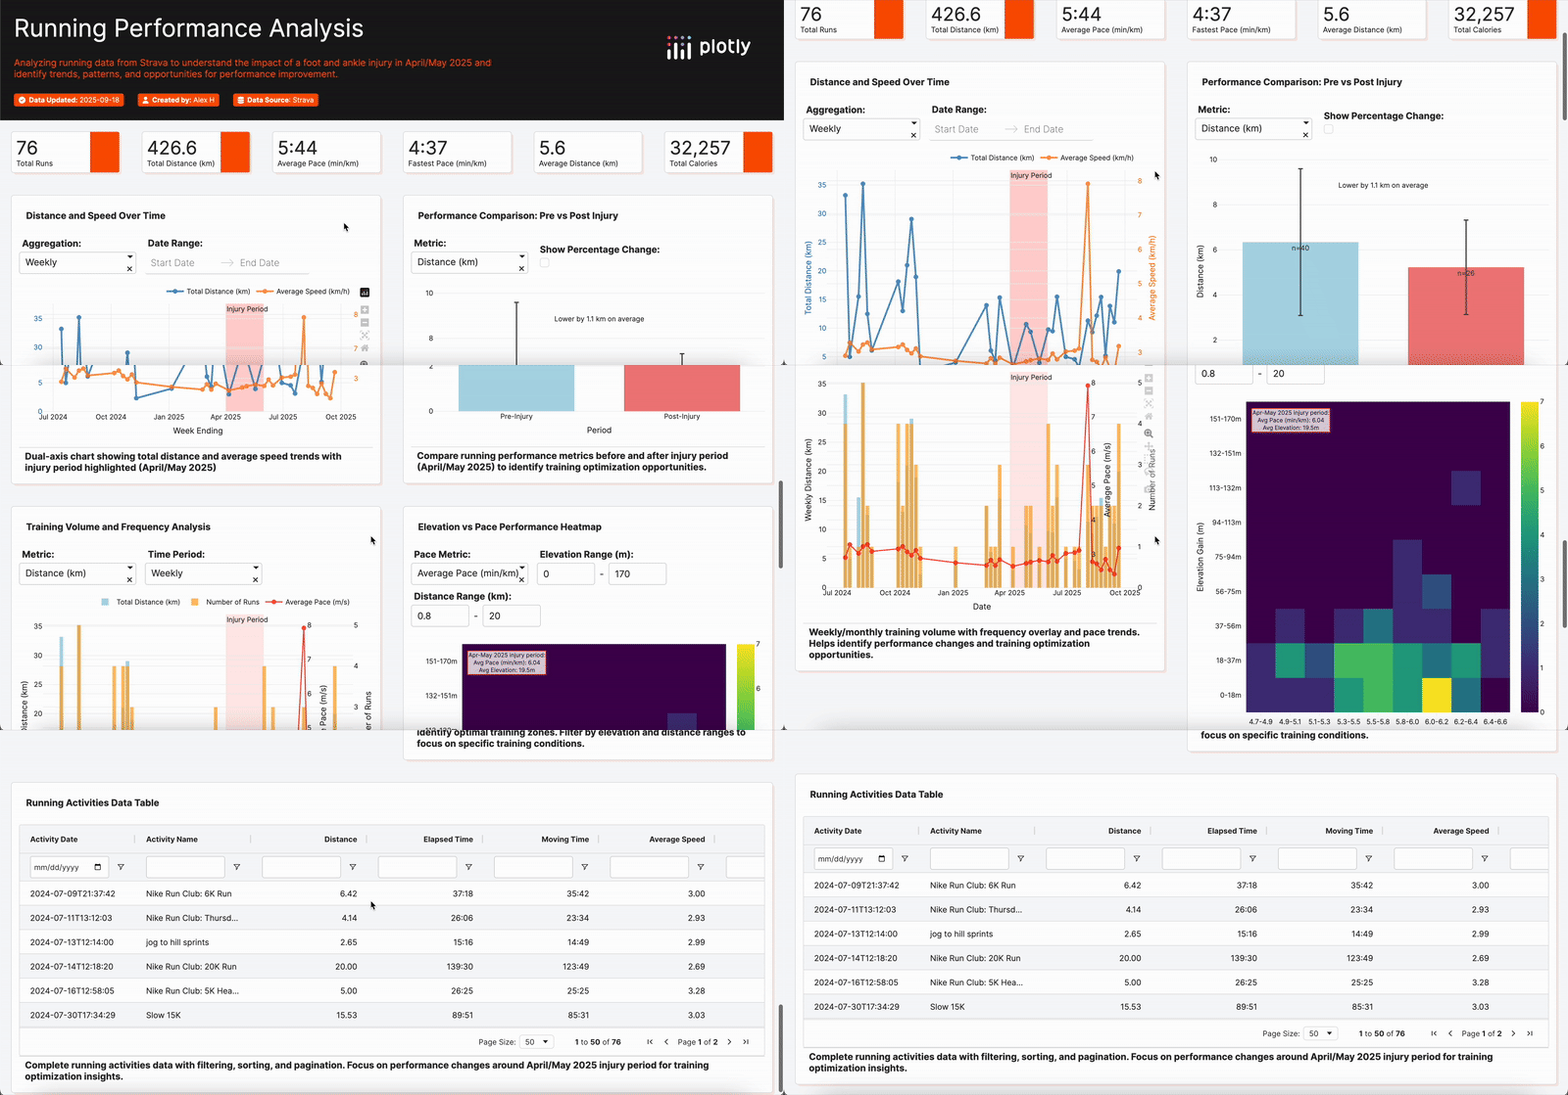
Hey all!
I was inspired by @samtripp’s post here to take a look at my own Strava data. I’m not really a fan of running, but as an amateur Muay Thai fighter, it’s part of the mandatory requirements of fight training. Plus, it’s an excellent form of leg conditioning. Like eating your vegetables to have dessert later ![]()
Unfortunately, I had an injury earlier this year during preparation for what would have been my first pay-per-view fight. This meant a period where I could barely run, let alone train Muay Thai. I wanted to see how the injury has affected my running performance and whether I’ve been making steady progress towards a full recovery.
Making an app to analyze this data was super easy using Plotly Studio! I requested that a vertical bar be added to the line charts to indicate the period when I was injured, and Plotly Studio did exactly that. Styling the app to blend the Strava and Plotly brand identities was easy and fun too! ![]()

Check out my app here, deployed to Plotly Cloud, and try out Plotly Studio for yourselves!