I found that plotting cones with lines changes the size of one cone.
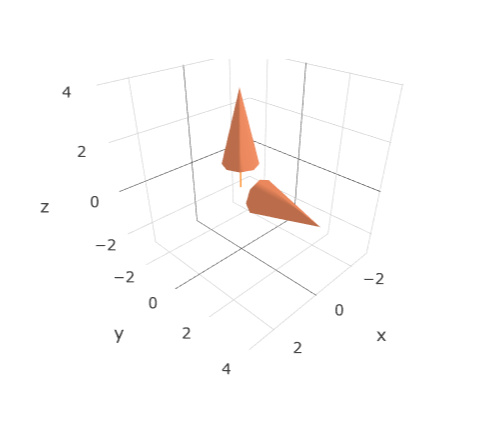
As a MWE, this script plot 2 cones and 1 line as desired.
var data = [{
      type: "cone",
      x: [0, 0],
      y: [1, 0],
      z: [0, 1],
      u: [0, 0],
      v: [1, 0],
      w: [0, 1],
      sizemode: "absolute",
      sizeref: 2,
      anchor: "tail"
},
      {type: "scatter3d",
      x: [0.0,0.0],
      y: [0.0,0.0],
      z: [0.0,1.0],
       mode:"lines",
           }]

var layout = {}

Plotly.plot('graph', data, layout)
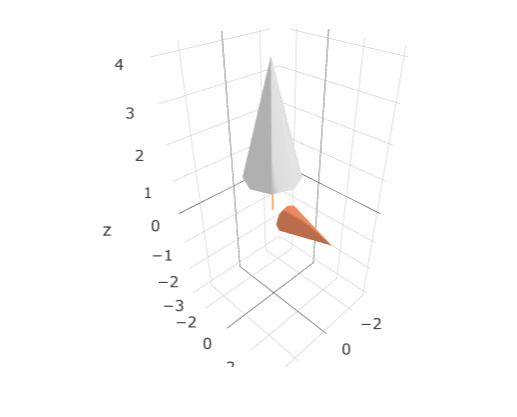
However, by changing the line length, one cone is also changed unexpectedly.
var data = [{
      type: "cone",
      x: [0, 0],
      y: [1, 0],
      z: [0, 1],
      u: [0, 0],
      v: [1, 0],
      w: [0, 1],
      sizemode: "absolute",
      sizeref: 2,
      anchor: "tail"
},
      {type: "scatter3d",
      x: [0.0,0.0],
      y: [0.0,0.0],
      z: [0.0,2.0],
       mode:"lines",
           }]

var layout = {}

Plotly.plot('graph', data, layout)
I am new to plotly. Is this a bug or I am missing something?