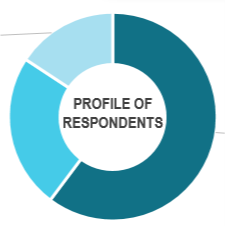
Hi,
I want to create a pie chart such that the slices of the pie are ordered clockwise in descending order based on the size of the pie, ie starting at 12 o’clock position and moving clockwise, we have the largest slice, followed by the 2nd largest slice and etc. See example below.

However, using Plotly go.Pie, i only managed to create the Pie Chart below.

Is there anyway to order the slices automatically based on size in clockwise direction? This is a good practice for displaying Pie Charts.
My python codes are as follows:
labels=['A', 'B', 'C']
values= [160, 80, 40]

donut_colors=['steelblue', 'lightskyblue', 'powderblue']

annotations=[]
annotations.append(dict(xref='paper', yref='paper',
  x=0.5, y=0.5,
  xanchor= 'center',
  yanchor='middle',
  text= '<b>PROFILE OF<br>RESPONDENTS</b>',
  font=dict(family="Arial", size=12),
  showarrow=False,
  ))

fig6 = go.Figure(data=[go.Pie(labels=labels, values=values, hole=.4, marker_colors=donut_colors, sort=False)])

fig6.update_traces(
  textposition='inside',
  textinfo='label+value+percent',
  showlegend=False,
)

fig6.update_layout(
 annotations=annotations
)

fig6.show()