smail
1
Hello everyone,
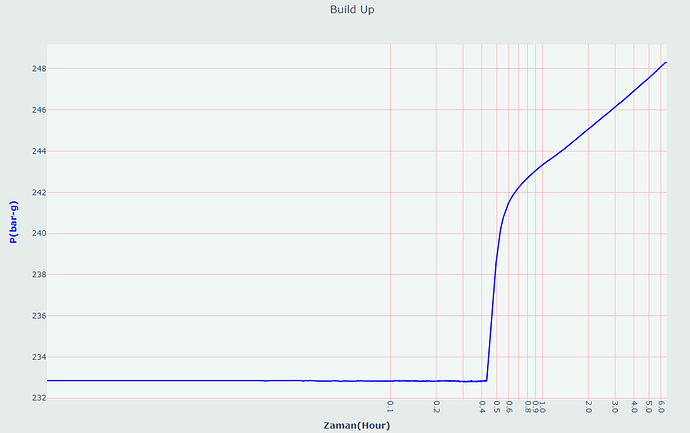
I want to try to reproduce this Plot with plotly only (not Dash).
So I think it’s better to use plotly express rather than plotly graph_objects.
else is there anyone who tried this example and get the same plot qualities as the original one?
https://dash.gallery/dash-lastodash-de/
Salutations
akroma
2
Hey @smail,
I did something like that in geothermal PT tests. I used plotly graph objects.
2 Likes
smail
3
I just found this video that answers my questions 
anyway, it needs some improvement to reach the original one.
Thanks
2 Likes
akroma
4
Great : )
If your data is not secret I would like to see end result.
Have a nice day.
2 Likes
smail
5
On my first day, I was struggling with filling the area if I have a threshold value
and I had this graph 
need more customization
See you tomorrow


