Plotly.express.scatter_mapbox not working with color_continuous_scale

fig = px.scatter_mapbox(df, lat="lat", lon="lon", color="data", color_continuous_scale=["#FF0000", "#00FF00"],
                                center=dict(lat=lat, lon=lon), zoom=4, size_max=10, opacity=0.2, range_color=[1, 10], title=filename)

In this code I am taking data in and plotting it with scatter_mapbox. The only issue is I need it to use a continuous colour scale, but it is not applying the colour to the map. Instead it just uses the default plotly colours.
Another issue is that the scale needs to range from 1 to 10, even while the input data may only reach 3 or 4, and the scale on the map is only 1-3 (as the inputted data doesnt go any higher, but it has the potential to).
Thanks

hi @Biotic
:wave: welcome to the Plotly community.

Could you share the data (or similar example data) with us so we can try to run this on our computer?

Thank you!
Of course here is a small sample:

id,pollutant,lat,lon,data
COP:LAT35:LON93,ensemble,55.44999985582004,0.8500000834465027,2
COP:LAT29:LON67,ensemble,56.04999877088949,-1.749999225139618,1
COP:LAT10:LON22,ensemble,57.95000040471837,-6.250000298023224,3
COP:LAT24:LON84,ensemble,56.55000040150185,-0.04998832941055298,2
COP:LAT41:LON10,ensemble,54.84999840602944,-7.450009882450104,2

This gets turned into a df where the “data” column is what should define the colour. The first 2 columns (id, pollutant) are not important to the final map

Hi @Biotic
I’m not clear on what you’re trying to solve with the issue of the color scaling 1 to 10, 1 to 3…

But, in regard to the color applying to the map, using your data above, this code seemed to have worked for me:

import plotly.express as px
import pandas as pd
df = pd.read_csv("test_data.csv")
fig = px.scatter_mapbox(df, lat='lat', lon="lon", color="data", color_continuous_scale=[[0, 'green'], [0.5, 'red'], [1.0, 'rgb(0, 0, 255)']],
                                zoom=4, size_max=10, opacity=0.8, range_color=[1, 10])
fig.update_layout(mapbox_style="open-street-map")


fig.show()

Is that what you were looking for or was it something else?

1 Like

That solution looks as if it would work! The only issue is that I am still getting the default plotly colour scheme as seen here:
image
and my code now looks like this:

fig = px.scatter_mapbox(df, lat="lat", lon="lon", color="data", color_continuous_scale=[[0, 'green'], [0.5, 'red'], [1.0, 'rgb(0, 0, 255)']],
                                center=dict(lat=54.6, lon=-3.2), zoom=5.4, opacity=0.2, range_color=[1, 10], title=title, width=805, height=1100)

Thank you for your help so far by the way :slight_smile:

That’s really weird. I’m getting different colors.

Try changing opacity to 0.8 to show the colors more brightly. Does that look any different?

What Plotly version are you using?

Im running Plotly v5.9.0 on Windows, with Python 3.10:
image
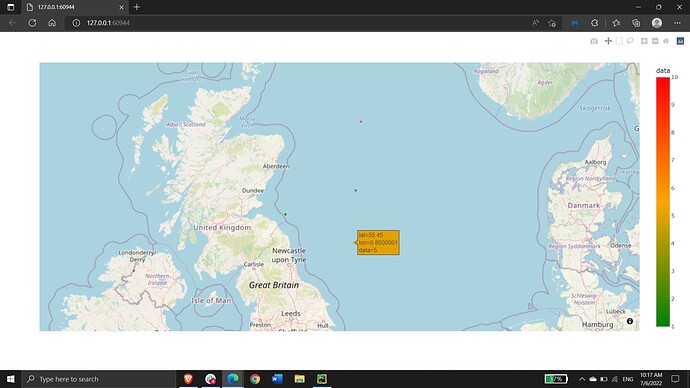
Just for clarification I attempting to get something similar to this:
image
Apologies for the blurry image

I changed a couple of data points to be 5 and 8, just so I can see the color distinction better. When I apply this code:

import plotly.express as px
import pandas as pd
df = pd.read_csv("test_data.csv")
fig = px.scatter_mapbox(df, lat='lat', lon="lon", color="data", color_continuous_scale=[[0, 'green'], [0.5, 'orange'], [1.0, 'red']],
                                zoom=4, size_max=10, opacity=0.8, range_color=[1, 10])
fig.update_layout(mapbox_style="open-street-map")

fig.show()

I get this image:

Is that what you’re looking for?

1 Like

Thats exactly what im looking for! Perhaps it a problem that my data only goes up to 3 when the theoretical maximum is 10? The actual data set is also almost 10,000 points so might that be causing issues too?
Weirdest thing too is that everything completely explodes if I don’t define a center and I start getting bugs saying “Cant convert string to numeric”?
Very lost here!

Example:

Traceback (most recent call last):
  File "C:\Users\durra\AppData\Local\Programs\Python\Python310\lib\site-packages\pandas\core\nanops.py", line 1622, in _ensure_numeric
    x = float(x)
ValueError: could not convert string to float: 'lat55.4499998558200456.0499987708894957.950000404718375
...
[EXTREMELY LONG RANDOM NUMBERS]
...
During handling of the above exception, another exception occurred:

Traceback (most recent call last):
  File "C:\Users\durra\AppData\Local\Programs\Python\Python310\lib\site-packages\pandas\core\nanops.py", line 1626, in _ensure_numeric
    x = complex(x)
ValueError: complex() arg is a malformed string

The above exception was the direct cause of the following exception:

Traceback (most recent call last):
  File "C:\Users\durra\Documents\Code\COPMapGen\cop_data_parse.py", line 231, in <module>
    fig = px.scatter_mapbox(df, lat="lat", lon="lon", color="data", range_color=[1, 10])
  File "C:\Users\durra\AppData\Local\Programs\Python\Python310\lib\site-packages\plotly\express\_chart_types.py", line 1247, in scatter_mapbox
    return make_figure(args=locals(), constructor=go.Scattermapbox)
  File "C:\Users\durra\AppData\Local\Programs\Python\Python310\lib\site-packages\plotly\express\_core.py", line 2277, in make_figure
    configure_axes(args, constructor, fig, orders)
  File "C:\Users\durra\AppData\Local\Programs\Python\Python310\lib\site-packages\plotly\express\_core.py", line 541, in configure_axes
    configurators[constructor](args, fig, orders)
  File "C:\Users\durra\AppData\Local\Programs\Python\Python310\lib\site-packages\plotly\express\_core.py", line 729, in configure_mapbox
    lat=args["data_frame"][args["lat"]].mean(),
  File "C:\Users\durra\AppData\Local\Programs\Python\Python310\lib\site-packages\pandas\core\generic.py", line 11127, in mean
    return NDFrame.mean(self, axis, skipna, level, numeric_only, **kwargs)
  File "C:\Users\durra\AppData\Local\Programs\Python\Python310\lib\site-packages\pandas\core\generic.py", line 10697, in mean
    return self._stat_function(
  File "C:\Users\durra\AppData\Local\Programs\Python\Python310\lib\site-packages\pandas\core\generic.py", line 10649, in _stat_function
    return self._reduce(
  File "C:\Users\durra\AppData\Local\Programs\Python\Python310\lib\site-packages\pandas\core\series.py", line 4468, in _reduce
    return op(delegate, skipna=skipna, **kwds)
  File "C:\Users\durra\AppData\Local\Programs\Python\Python310\lib\site-packages\pandas\core\nanops.py", line 93, in _f
    return f(*args, **kwargs)
  File "C:\Users\durra\AppData\Local\Programs\Python\Python310\lib\site-packages\pandas\core\nanops.py", line 155, in f
    result = alt(values, axis=axis, skipna=skipna, **kwds)
  File "C:\Users\durra\AppData\Local\Programs\Python\Python310\lib\site-packages\pandas\core\nanops.py", line 410, in new_func
    result = func(values, axis=axis, skipna=skipna, mask=mask, **kwargs)
  File "C:\Users\durra\AppData\Local\Programs\Python\Python310\lib\site-packages\pandas\core\nanops.py", line 698, in nanmean
    the_sum = _ensure_numeric(values.sum(axis, dtype=dtype_sum))
  File "C:\Users\durra\AppData\Local\Programs\Python\Python310\lib\site-packages\pandas\core\nanops.py", line 1629, in _ensure_numeric
    raise TypeError(f"Could not convert {x} to numeric") from err
TypeError: Could not convert lat55.4499998558200456.049
...
to numeric

Solved!
Im not sure why but the issue was with my method of reading in dataframes from CSV.
For some reason this broke everything:

df = pd.read_csv(f, index_col="id",
                        names=["id", "pollutant", "lat", "lon", "data"])

While this works absolutely fine:

df = pd.read_csv(f)

My guess is my reading in the ID column twice, as both an index and column but I am unsure of this.

1 Like