My goal is to create ratios from two filtered columns in a Pandas data frame, then use Plotly Express to create a bar chart using px.bar() . I’m able to do so using the base plot() function in Pandas, but not the px.bar() function in Plotly Express .
One problem that I ran into was that some of the columns contain duplicate values. This resulted in my having to do some Pandas gymnastics.
Here is my data:
test_df = pd.DataFrame({'Manufacturer':['Ford', 'Ford', 'Mercedes', 'BMW', 'Ford', 'Mercedes', 'BMW', 'Ford', 'Mercedes', 'BMW', 'Ford', 'Mercedes', 'BMW', 'Ford', 'Mercedes', 'BMW', 'Ford', 'Mercedes', 'BMW'],
                          'Metric':['Orders', 'Orders', 'Orders', 'Orders', 'Orders', 'Orders', 'Orders', 'Sales', 'Sales', 'Sales', 'Sales', 'Sales', 'Sales', 'Warranty', 'Warranty', 'Warranty', 'Warranty', 'Warranty', 'Warranty'],
                          'Sector':['Germany', 'Germany', 'Germany', 'Germany', 'USA', 'USA', 'USA', 'Germany', 'Germany', 'Germany', 'USA', 'USA', 'USA', 'Germany', 'Germany', 'Germany', 'USA', 'USA', 'USA'],
                          'Value':[45000, 70000, 90000, 65000, 40000, 65000, 63000, 2700, 4400, 3400, 3000, 4700, 5700, 1500, 2000, 2500, 1300, 2000, 2450],
                          'City': ['Frankfurt', 'Bremen', 'Berlin', 'Hamburg', 'New York', 'Chicago', 'Los Angeles', 'Dresden', 'Munich', 'Cologne', 'Miami', 'Atlanta', 'Phoenix', 'Nuremberg', 'Dusseldorf', 'Leipzig', 'Houston', 'San Diego', 'San Francisco']
                       })
Due to some duplicate values, I create a temporary table:
temp_table = test_df.reset_index().pivot_table(values = 'Value', index = ['Manufacturer', 'Metric', 'Sector'], aggfunc='sum')
Then, reset the index:
df_new = temp_table.reset_index()
Then,
s1 = df_new.set_index(['Manufacturer','Sector']).query("Metric=='Orders'").Value
s2 = df_new.set_index(['Manufacturer','Sector']).query("Metric=='Sales'").Value
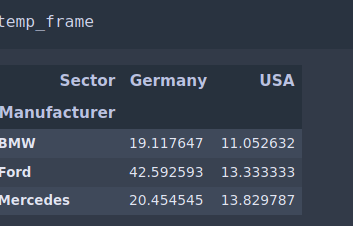
Then, unstack and plot:
temp_frame = s1.div(s2).unstack()
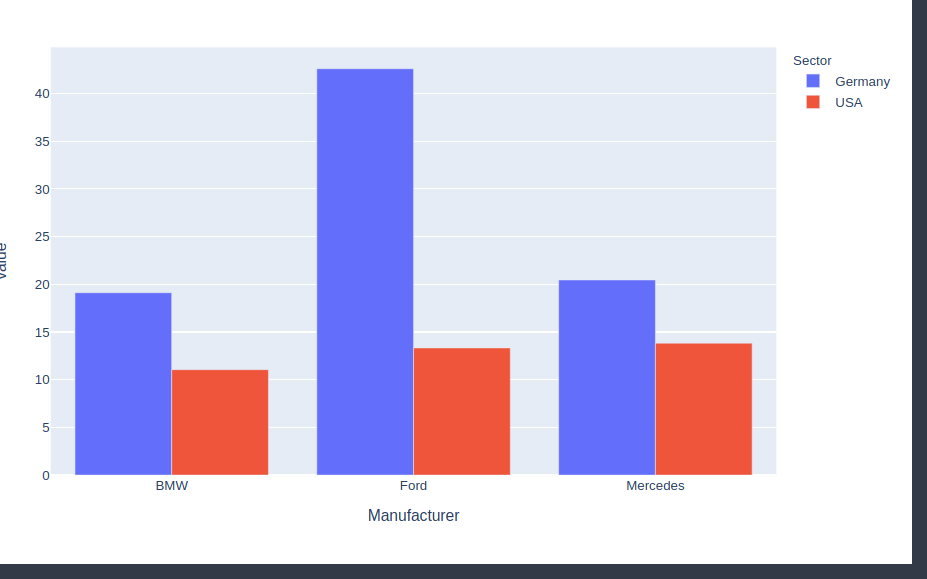
temp_frame.plot(kind='bar')
This works perfectly and produces the following bar plot using the standard Pandas plot() function:

Now, I attempt to plot using the px.bar() function in Plotly Express :
px.bar(temp_frame, x='Sector', y='Value', color='Exchange',
                            barmode='group',
                            text='Value',
                            title='Order to Sales Ratio)
This code results in the following error message:
ValueError: Value of 'x' is not the name of a column in 'data_frame'. Expected one of ['Germany', 'USA'] but received: Sector
This error looks related to the issue reported in Use Pandas index in Plotly Express. But, I think my data frame is not configured in such a way that I can implement the “ugly fix” solution suggested by @Laurens Koppenol and validated by @nicolaskruchten .
Can anyone help me resolve this error so that I can create the bar plot above using Plotly Express ?
Thanks in advance!