I’m primarily a visual thinker, so I don’t get some of the abstractions that are made with callbacks – outside the tutorials, that is. I’m NOT using GUI elements like Dropdown menus or Sliders. Here’s a fun flowchart I made to try to grasp this:
My questions are annotated in that flowchart. When using custom functions - how do I get the values where they need to be, and how do I define those values properly in the “property” of the callback? (The top component should be named myComponentToListenTo – oops)
I’ve done forum searches, but its seems I’m trying to do something that hasn’t been asked - so either I’m a total idiot (possible) or no one has bothered to drill down on this recently.
Please help me, willing to pay a bounty in Bitcoin if that adds incentive.
I’m not expecting you to write a lot of code for me – I can do that – I just want a clear paint-by-numbers kind of explanation for custom functions like my flowchart indicates.
Many thanks – and I’ll try to keep contributing examples to help people, so you know I’m not some fly-by-night guy that doesn’t give back.
Your flow chart depicts correctly how Dash callbacks work - now it’s just a matter of using the correct components and props for the Inputs and Outputs of your callbacks.
I recommend starting with this new tutorial - Dash in 20 minutes:
Then dig into each section of the next chapter - “Dash Fundamentals”
If you like to learn by examples, you might find this site helpful:
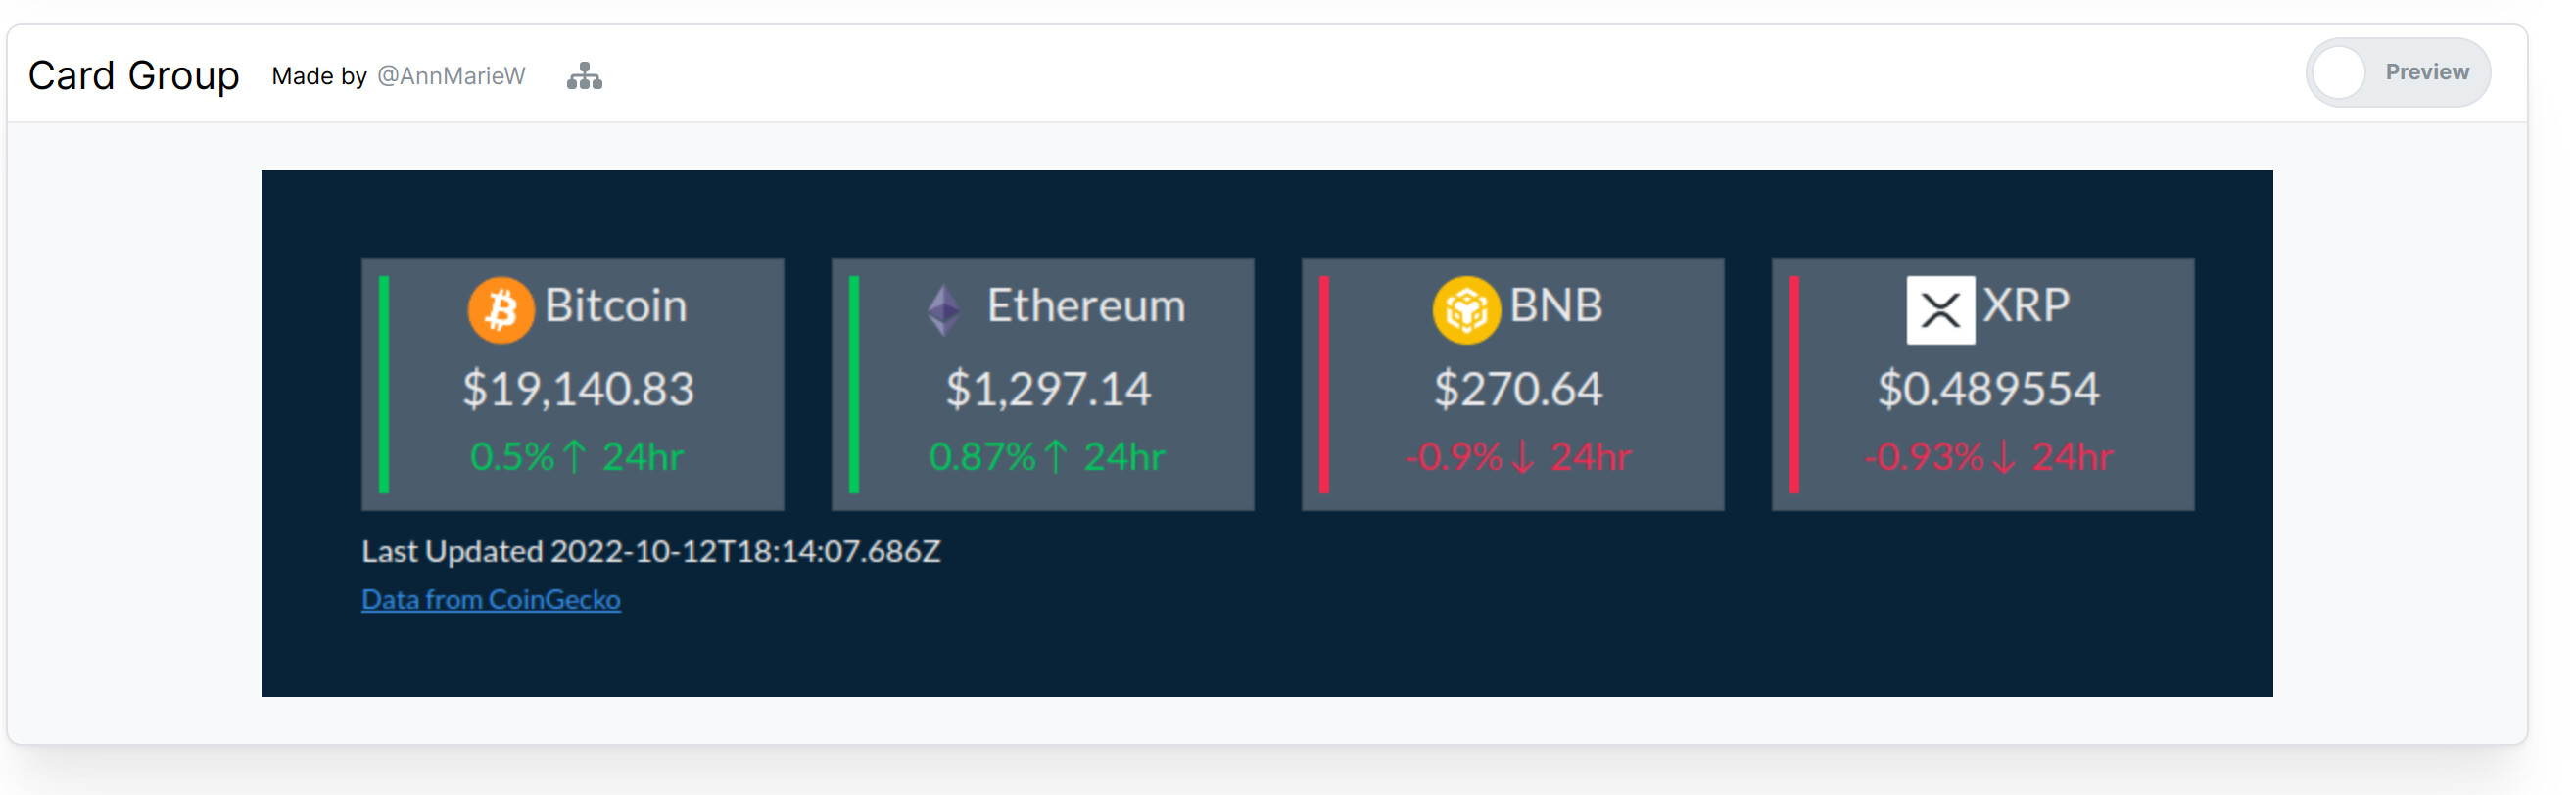
And no bitcoin bounty necessary - you can find some nice examples on layout and design ideas at this site too - including a bitcoin example app
Thanks, I’ll sift through those – I hope there’s an example in there that isn’t based on drop-down menus and sliders, or any other established tutorial method.
I’ll report back when I’ve looked at your sources - thank you.
@AnnMarieW - thank you for taking the time to respond. I haven’t worked through your examples yet – but I’ll attempt to describe what I’m trying to do.
I have this working using box-select, which fires a callback that passes the selected points data to a function I’ve written.
My problem is how to initiate yet-another function to take the processed output, so it can do some things and update a separate figure.
So, the ASCII flow diagram is like:
(User selects price bars) → Callback looking at SelectData fires → Custom function processes price data → (my stumbling block) Another custom function then takes this data and passes it to another figure so it updates.
In most examples I’ve run across, they only mention GUI elements and the like.
That part I totally get – there are states for those items and when they fire, you do things based on that stuff.
What I haven’t seen is how to create a CUSTOM callback or chained callback to do what I’m proposing. Is this out of the realm of possibility, or what have I missed?
I deeply appreciate your attention to my newbie problems, truly.
Thanks for the resource, and I did look at Interactive Graphing.
The problem is that figures have built-in attributes, like SelectedData – so doing a callback for that is easy.
My problem is I want to define CUSTOM attributes and pass that to a callback.
At this point, I may have to do the very-hacky-and-inelegant-method of using dcc.Store or something similar, which really blows my mind – why can’t I do this all in memory instead of tasking a slow I/O process (comparatively) to do this?
If you could point me to an example that does this:
Custom Function → Callback Definition Listening for attribute of custom function → Triggered action causes output to pass data to children
Then I’d be very thankful. Otherwise, it seems that Plotly never considered something like this scenario which is mind-boggling to me.
Edit – I suppose the closest my request comes to is this – Can Data Attributes Be Created In Dash? except I want to have a custom function return an attribute. This is pretty depressing if true.
I’ll do a explainer on it, there were a few things that I had thought were in force that weren’t true - and I managed to confuse myself along the way, so that didn’t help either.
Appreciate the help from AnnMarie, she was very patient.
The thing that accomplished devs should keep in mind is that a newbie, totally unaware and unexperienced with the docs/functions/methods of Plotly has a long uphill slog when doing things that diverge from the tutorials.
Maybe everyone else is able to pick it up in a flash and I’m the lone idiot trying to climb a mountain of my own ignorance, but its not easy to pick through things and make it work.
Its okay, I’ll just do another explainer so people like me who are climbing through the thorn bushes up the cliffside have a prayer of making it
Just a quick update before I post an actual explainer with code on all this.
First - I got sidetracked by a notion that grabbed hold of me at 2am looking at the editor, this erroneous idea was that the property that triggers a callback was the ONLY thing that could be passed out of it. Yeah, I know, not true – but I went down a rabbit hole of increasingly baroque workarounds for a problem that didn’t exist
Such is the learning process.
Now, I have things working without resorting to chained callbacks or multiple outputs or anything like that. Its very elegant and I’m relieved that its very sane to do.
I will post a clarification on all this to demonstrate it, just wanted to throw that out there if someone got into that mode and is struggling with it.
Appreciate the patience of @AnnMarieW and @AIMPED through this misadventure. Making progress…