Hi all,
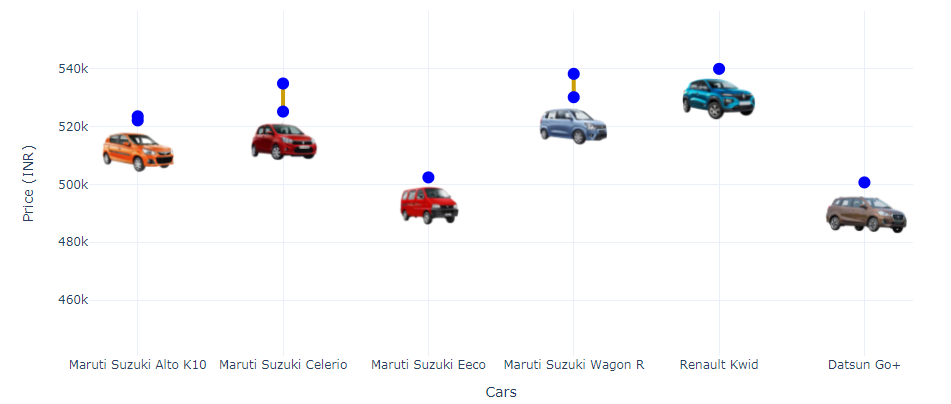
I have a data of some car models and their prices and I am plotting a plotly graph as car models on x-axis and their prices on y-axis as shown in figure below. As can be seen from the figure, I am also placing the images of car models at corresponding points in plot.
I am using the following code to plot the graph:
# define the range
min_value = cars_df['onroad_price'].min()
max_value = cars_df['onroad_price'].max()


lt = go.Layout(yaxis=dict(range=[int(min_value)-ylimit, int(max_value)+ 20000]))
# Create figure
fig = go.Figure(layout=lt)

# Add trace
for mx in plot_points_vertically_models:
    fig.add_trace(mx)


for xname, name_of_image_in_folder, variant_name in zip(images_label_list, image_name, list(model_and_price_dct.keys())):
    fig.add_layout_image(
        dict(
            x=xname,
            xanchor = "center",
            sizex=200000,
            y=min(model_and_price_dct[variant_name]),
            sizey=ysize,
            xref="x",
            yref="y",
            opacity=1.0,
            layer="above",
            sizing="contain",
            source=Image.open(f'image_path/{name_of_image_in_folder}.png')
        )
    )
The code works fine when number of car models on the xaxis are 6 or above. But when the number of car models go below 6, the code is not able to show any images in the graph and just plots the points. To see the Images I have to change the xanchor in add_layout_image to ‘left’. But this place the images a bit offset from the corresponding point as shown in figure below.

Any ideas about what might be going wrong? How can I place the images properly in centre?
Thanks in advance