I would like to add images to the rows in a Plotly Table, but could not find a good solution.
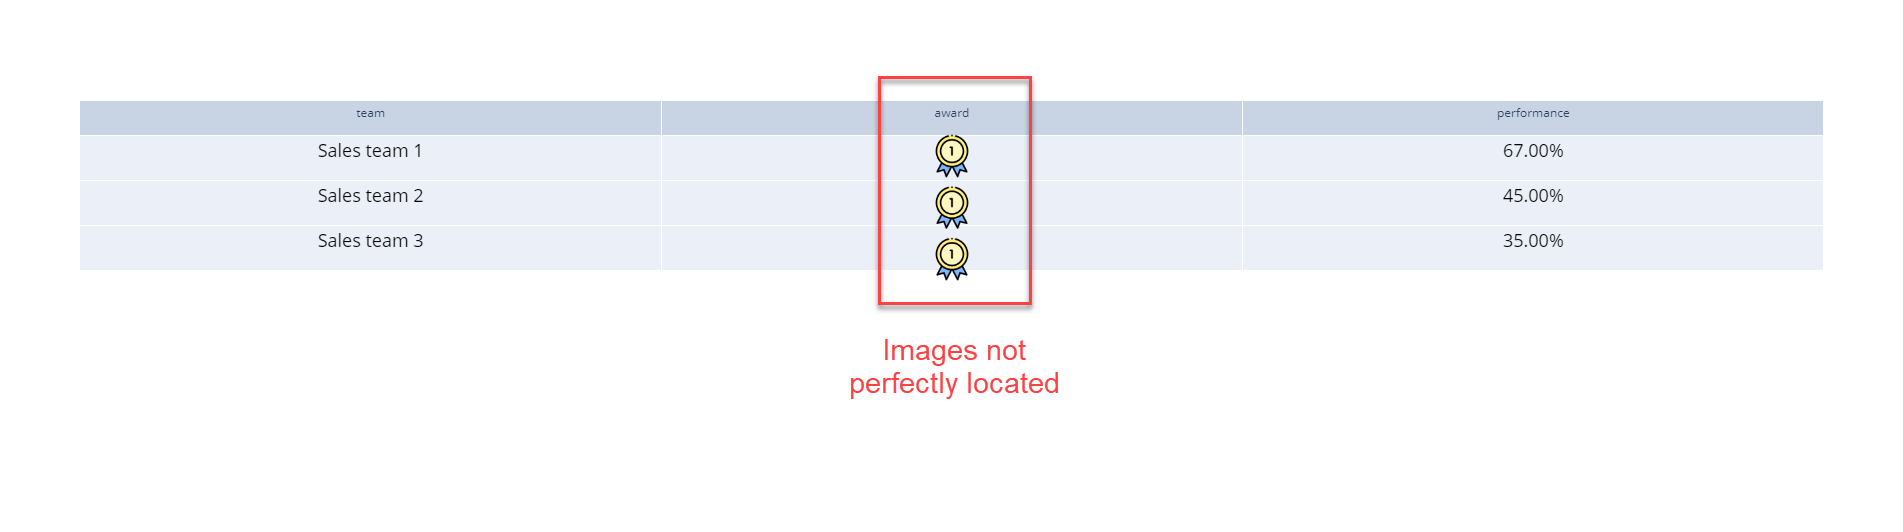
As an alternative option, I am using the method add_layout_image() placing the images approximately at the row space - see the example of what I am trying to achieve.
Anyone has a better solution!?
import plotly.graph_objects as go
import pandas as pd
import base64

data = {'team': {1: 'Sales team 1', 2: 'Sales team 2', 3: 'Sales team 3'},
        'award': {1: '', 2: '', 3: ''},
        'performance': {1: '67.00%', 2: '45.00%', 3: '35.00%'}}

df = pd.DataFrame(data)

fig = go.Figure(data=[go.Table(

    columnwidth=[40, 40, 40],

    header=dict(
        values=list(df.columns),
        height=35),

    cells=dict(
        values=[df.team,
                df.award,
                df.performance],
        align=['center', 'center', 'center'],
        font=dict(color='black', size=18),
        height=45)
)])

heightRow = fig.data[0].cells.height
numberRow = fig.data[0].cells.values[0].__len__()

image_1st = 'medal1st.png'
image_1st_base64 = base64.b64encode(open(image_1st, 'rb').read())

step_y = 1 / numberRow * .2
coordinate_y = 0

for index, eachRow in enumerate(df.iterrows()):
    fig.add_layout_image(
        source='data:image/png;base64,{}'.format(image_1st_base64.decode()),
        x=0.5,
        y=.9 - coordinate_y,
        xref="x domain",
        yref="y domain",
        xanchor="center",
        yanchor="bottom",
        sizex=.055,
        sizey=.055,
    )

    coordinate_y = coordinate_y + step_y

fig.show()