Hi guys, I’m running into a problem that I cannot figure out regarding the behavior of extendData in Dash. For my thesis I am exploring real-time data loading, and I’m testing out Dash to create an app for dynamically loading in data, and then dynamically updating user-configured graphs whenever new data is coming in.
Before going into too much detail, a brief explanation of how my app works and what issue I’m encountering, in the case this behavior is familiar to anyone else (I couldn’t find much about it online):
- User connects to an external data source (currently dummy data)
- Every interval, new data is retrieved and stored in dcc.Store component
- User can add/delete graphs (dcc.Graph component with Plotly Express figure) by selecting graph type and X/Y-variable
- When new data is stored, each graph is extended with a pattern-matching callback.
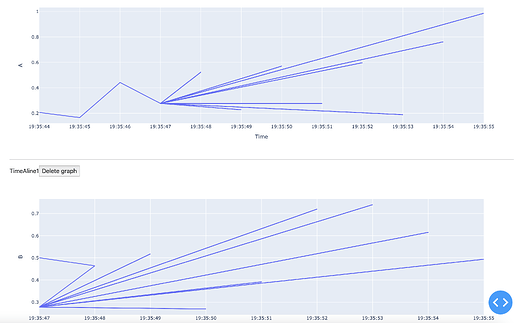
When I add a second (or third, fourth, etc.) graph, newly retrieved data is correctly extended AND duplicate data from the moment I click ‘add graph’ is added every interval (1 second). This creates a very strange zigzag pattern in line graphs, and I can see in the debug that old data is added incorrectly. Does anyone have an idea what is going on when multiple graphs are extended in this scenario, where an interval extends each graph?
Below is an image of how it looks like. You can see it goes wrong at 19:35:47, the moment I added the second graph.
In the second picture, you can see that the data from 19:35:47 is duplicated twice, alongside the correct data each second.
In more detail:
- The user connects to an external data source using the app (currently it retrieves dummy data). data is retrieved when n_interval of an Interval object changes, this retrieved data is stored in a Store component.
Retrieving data code
# Callback to retrieve and store data each time the interval passes
# When the interval is triggered, store new data into the short 'data_store'
# And store entire dataset in 'dataLlongterm_store' (WIP)

@app.callback(
    Output(component_id='data_store', component_property='data'),
    Output(component_id='data_longterm_store', component_property='data'),
    Output(component_id='connector-button', component_property='n_clicks'),
    Input(component_id='data_interval', component_property='n_intervals'),
    State({'type': 'connection_input', 'index': ALL}, 'id'),
    State({'type:': 'connection_input', 'index': ALL}, 'value'),
    State(component_id='connector-button', component_property='n_clicks'),
    prevent_initial_call=True
)

def retrieve_data(interval, connector_id, value, n_clicks):
    # Test variables for now
    if n_clicks == 1:
        n_clicks += 1
    else:
        n_clicks = dash.no_update

    if connector_id[0]['index'] == None:
        print('Something is going wrong!')
        return [0], [0], n_clicks

    elif connector_id[0]['index'] == 'IP_input':
        values = confunc.dummy_connect_dict(value)
        return values, values, n_clicks

    elif connector_id[0]['index'] == 'TCP1_input':
        values = confunc.dummy_connect_dict(value)
        return values, values, n_clicks
- The user selects a variable for the X and Y-axis in a new div that appears after connecting to the data source. When clicking on ‘Add graph’, a new graph is created which uses data from the Store component. The user can add (or delete) as many graphs as they like.
Adding/deleting graph code
# Callback to add a new graph div when add graph is clicked
# When either add_graph_button or dynamic_delete_button is triggered
# Either add a new graph child to the children of graph_content_area
# Or delete the child based on index and update the children of graph_content_area
@app.callback(
    Output(component_id= 'graph_content_area', component_property= 'children'),
    Output(component_id= 'graph_configs_store', component_property= 'data'),
    Input(component_id= 'add_graph_button', component_property= 'n_clicks'),
    Input({'type': 'dynamic_delete_button', 'index': ALL}, 'n_clicks'),
    State(component_id= 'dropdown_X', component_property= 'value'),
    State(component_id= 'dropdown_Y', component_property= 'value'),
    State(component_id= 'dropdown_graph_type', component_property= 'value'),
    State(component_id= 'graph_content_area', component_property= 'children'),
    State(component_id= 'data_store', component_property= 'data'),
    State(component_id= 'graph_configs_store', component_property= 'data'),
    prevent_initial_call= True
)

def add_delete_graph(n_clicks, _, x, y, graph_type, div_children, data, graph_config):
    if n_clicks > 0 and ctx.triggered_id == 'add_graph_button':

        graph_config[str(n_clicks)] = [x, y]

        x_data = [data[x]]
        y_data = [data[y]]
        data = {x : x_data, y: y_data}

        if graph_type == 'line':
            fig = px.line(data, x= x, y= y)
            graph = dcc.Graph(id={'type': 'dynamic_graph', 'index': n_clicks}, figure= fig)
        elif graph_type == 'bar':
            fig = px.bar(data, x= x, y= y)
            graph = dcc.Graph(id={'type': 'dynamic_graph', 'index': n_clicks}, figure= fig)
        elif graph_type == 'scatter':
            fig = px.scatter(data, x= x, y= y)
            graph = dcc.Graph(id={'type': 'dynamic_graph', 'index': n_clicks}, figure= fig)

        new_child = html.Div(id= {'type': 'dynamic_graph_div', 'index': n_clicks},
        children=[
            graph,
            html.Hr(),
            x, y, graph_type, n_clicks,
            html.Button('Delete graph', id={'type': 'dynamic_delete_button', 'index': n_clicks})
        ])
        div_children.append(new_child)

    elif n_clicks > 0 and ctx.triggered_id['type'] == 'dynamic_delete_button':
        del graph_config[str(ctx.triggered_id["index"])]

        delete_index = ctx.triggered_id["index"]
        div_children = [
            child for child in div_children
            if "'index': " + str(delete_index) not in str(child)
        ]

    return div_children, graph_config
- Whenever new data is stored, a dynamic callback extends data for each existing graph using extendData.
Extending graph code
# Callback to extend data to each graph that exists
@app.callback(
    Output({'type': 'dynamic_graph', 'index': MATCH}, 'extendData'),
    Input('data_store', 'data'),
    State({'type': 'dynamic_graph', 'index': MATCH}, 'id'),
    State('graph_configs_store', 'data'),
    prevent_initial_call=True
)
def update_data(data_store, graph_id, graph_configs):

    # Extract the index from the graph_id
    index = graph_id['index']

    # Retrieve the configuration for the current graph
    config = graph_configs.get(str(index), None)

    if config:
        x_var, y_var = config
        x_data = data_store.get(x_var, [])
        y_data = data_store.get(y_var, [])

        # Prepare the data to extend
        extend_data = {
            'x': [[x_data]],
            'y': [[y_data]]
        }

        return extend_data
    else:
        return dash.no_update

