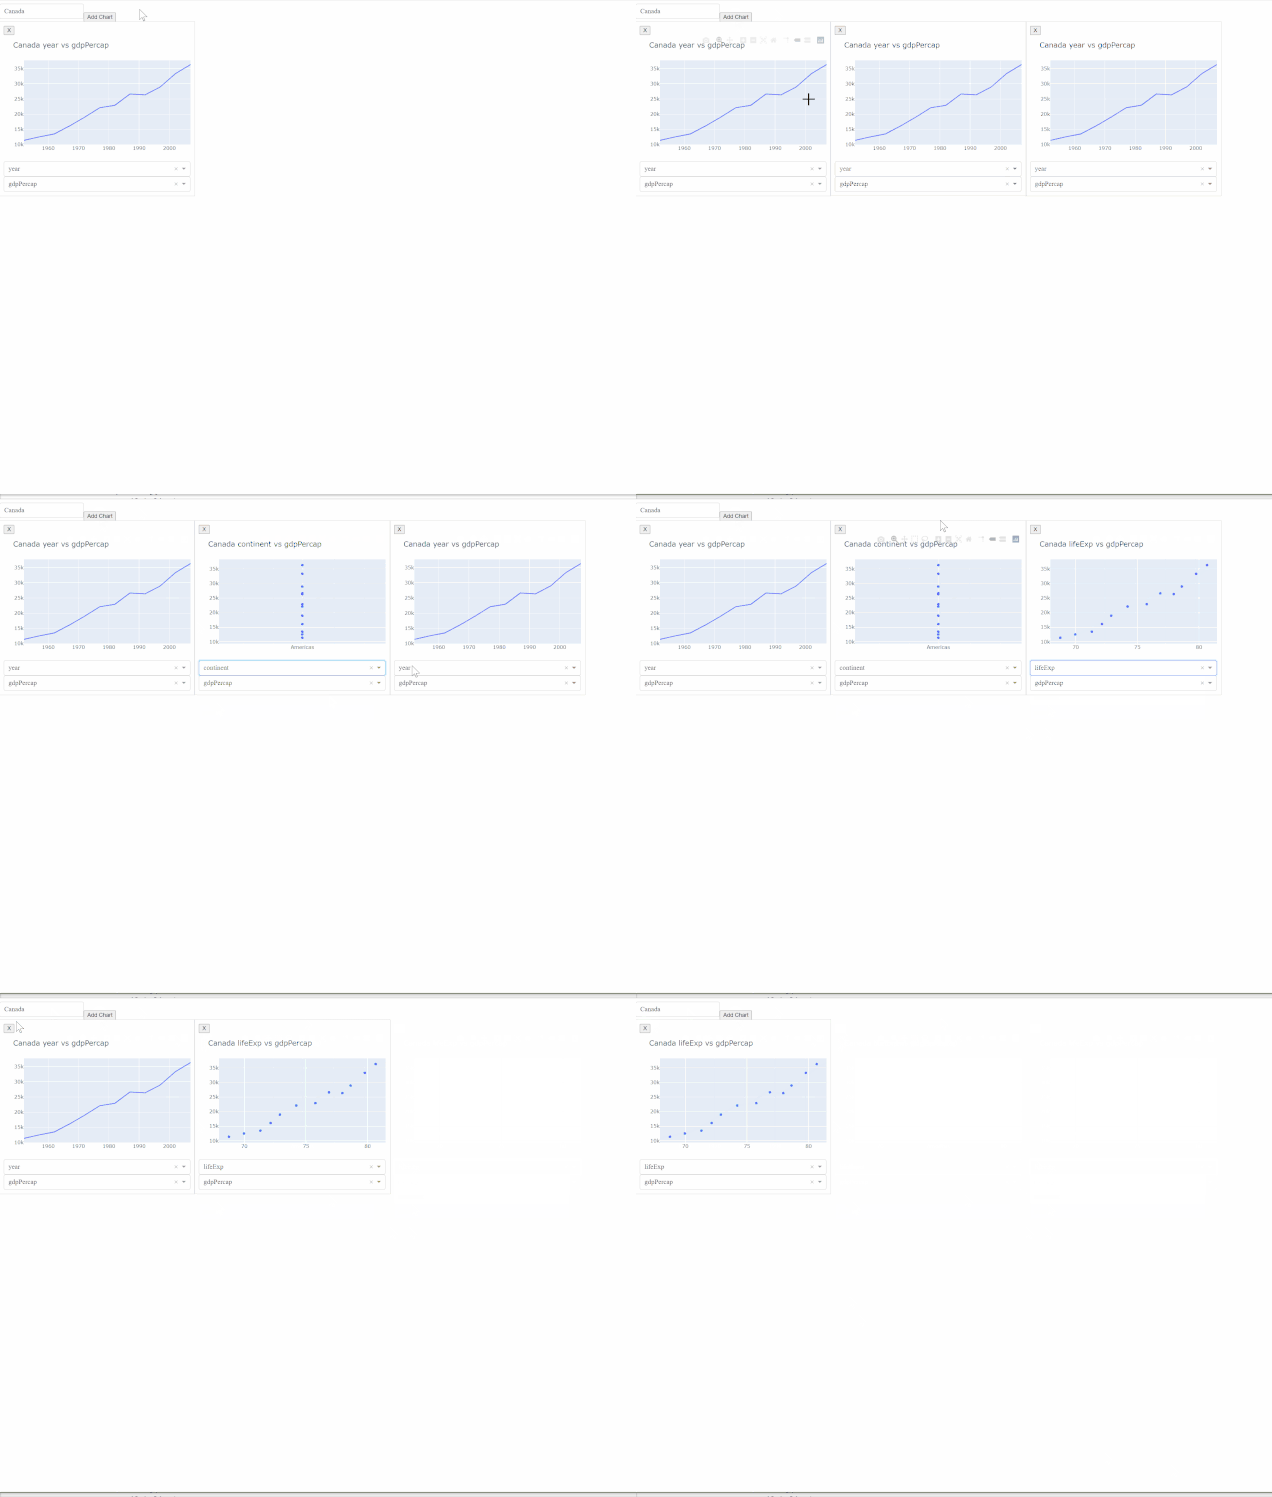
Hi!
I got this to work by adding a button with an “X” that would trigger the callback to remove the chart.
Here is this feature added to the example app from 📣 Dash v1.11.0 Release - Introducing Pattern-Matching Callbacks
import dash
from dash.dependencies import Input, Output, State, ALL, MATCH
import dash_html_components as html
import dash_core_components as dcc
import plotly.express as px
import json

df = px.data.gapminder()

app = dash.Dash(__name__)

app.layout = html.Div(
    [
        html.Div(
            children=[
                dcc.Dropdown(
                    options=[{"label": i, "value": i} for i in df.country.unique()],
                    value="Canada",
                    id="country",
                    style={"display": "inline-block", "width": 200},
                ),
                html.Button(
                    "Add Chart",
                    id="add-chart",
                    n_clicks=0,
                    style={"display": "inline-block"},
                ),
            ]
        ),
        html.Div(id="container", children=[]),
    ]
)


def create_figure(column_x, column_y, country):
    chart_type = px.line if column_x == "year" else px.scatter
    return (
        chart_type(df.query("country == '{}'".format(country)), x=column_x, y=column_y,)
        .update_layout(
            title="{} {} vs {}".format(country, column_x, column_y),
            margin_l=10,
            margin_r=0,
            margin_b=30,
        )
        .update_xaxes(title_text="")
        .update_yaxes(title_text="")
    )


@app.callback(
    Output("container", "children"),
    [
        Input("add-chart", "n_clicks"),
        Input({"type": "dynamic-delete", "index": ALL}, "n_clicks"),
    ],
    [State("container", "children"), State("country", "value")],
)
def display_dropdowns(n_clicks, _, children, country):
    default_column_x = "year"
    default_column_y = "gdpPercap"

    input_id = dash.callback_context.triggered[0]["prop_id"].split(".")[0]
    if "index" in input_id:
        delete_chart = json.loads(input_id)["index"]
        children = [
            chart
            for chart in children
            if "'index': " + str(delete_chart) not in str(chart)
        ]
    else:
        new_element = html.Div(
            style={
                "width": "23%",
                "display": "inline-block",
                "outline": "thin lightgrey solid",
                "padding": 10,
            },
            children=[
                html.Button(
                    "X",
                    id={"type": "dynamic-delete", "index": n_clicks},
                    n_clicks=0,
                    style={"display": "block"},
                ),
                dcc.Graph(
                    id={"type": "dynamic-output", "index": n_clicks},
                    style={"height": 300},
                    figure=create_figure(default_column_x, default_column_y, country),
                ),
                dcc.Dropdown(
                    id={"type": "dynamic-dropdown-x", "index": n_clicks},
                    options=[{"label": i, "value": i} for i in df.columns],
                    value=default_column_x,
                ),
                dcc.Dropdown(
                    id={"type": "dynamic-dropdown-y", "index": n_clicks},
                    options=[{"label": i, "value": i} for i in df.columns],
                    value=default_column_y,
                ),
            ],
        )
        children.append(new_element)
    return children


@app.callback(
    Output({"type": "dynamic-output", "index": MATCH}, "figure"),
    [
        Input({"type": "dynamic-dropdown-x", "index": MATCH}, "value"),
        Input({"type": "dynamic-dropdown-y", "index": MATCH}, "value"),
        Input("country", "value"),
    ],
)
def display_output(column_x, column_y, country):
    return create_figure(column_x, column_y, country)


if __name__ == "__main__":
    app.run_server(debug=True)
