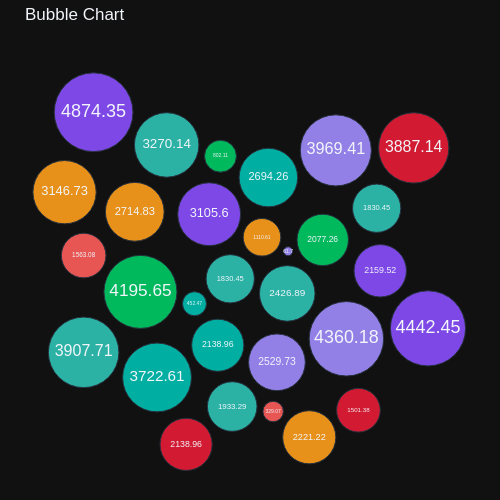
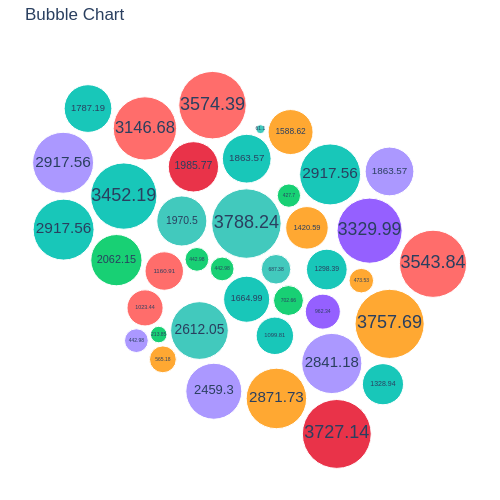
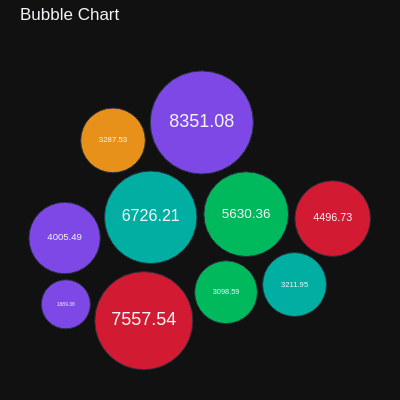
This type of chart displays data using bubbles of varying sizes, arranged in a compact layout without overlaps, allowing for visual comparison of relative magnitudes within a limited space. Each bubble represents a category or entity, and its size is directly related to a quantitative value. I hope you find it useful.
import numpy as np
import pandas as pd
import plotly.graph_objects as go

class BubbleChartPlotly:
    def __init__(self, labels, area, colors, bubble_spacing=10, plot_diameter=500):
        self.labels = labels
        self.colors = colors
        self.area = np.asarray(area)
        self.plot_diameter = plot_diameter
        self.plot_radius = plot_diameter / 2.5
        self.bubble_spacing = bubble_spacing
        total_area = np.sum(self.area)
        max_allowed_area = (np.pi * (self.plot_radius ** 2)) * 0.6
        scale_factor = max_allowed_area / total_area
        self.scaled_area = self.area * scale_factor
        self.radii = np.sqrt(self.scaled_area / np.pi)
        self.bubbles = np.ones((len(area), 4))
        self.bubbles[:, 2] = self.radii
        self.bubbles[:, 3] = self.scaled_area
        self.maxstep = 2 * self.bubbles[:, 2].max() + self.bubble_spacing
        self.step_dist = self.maxstep / 2
        length = np.ceil(np.sqrt(len(self.bubbles)))
        grid = np.arange(length) * self.maxstep
        gx, gy = np.meshgrid(grid, grid)
        self.bubbles[:, 0] = gx.flatten()[:len(self.bubbles)]
        self.bubbles[:, 1] = gy.flatten()[:len(self.bubbles)]
        self.com = self.center_of_mass()

    def center_of_mass(self):
        return np.average(self.bubbles[:, :2], axis=0, weights=self.bubbles[:, 3])

    def center_distance(self, bubble, bubbles):
        return np.hypot(bubble[0] - bubbles[:, 0], bubble[1] - bubbles[:, 1])

    def outline_distance(self, bubble, bubbles):
        return self.center_distance(bubble, bubbles) - bubble[2] - bubbles[:, 2] - self.bubble_spacing

    def check_collisions(self, bubble, bubbles):
        distance = self.outline_distance(bubble, bubbles)
        return len(distance[distance < 0])

    def collides_with(self, bubble, bubbles):
        distance = self.outline_distance(bubble, bubbles)
        return np.argmin(distance, keepdims=True)

    def collapse(self, n_iterations=100):
        for _ in range(n_iterations):
            moves = 0
            for i in range(len(self.bubbles)):
                rest_bub = np.delete(self.bubbles, i, 0)
                dir_vec = self.com - self.bubbles[i, :2]
                norm = np.linalg.norm(dir_vec)
                if norm == 0:
                    continue
                dir_vec = dir_vec / norm
                new_point = self.bubbles[i, :2] + dir_vec * self.step_dist
                new_bubble = np.append(new_point, self.bubbles[i, 2:4])

                if not self.check_collisions(new_bubble, rest_bub):
                    self.bubbles[i, :] = new_bubble
                    self.com = self.center_of_mass()
                    moves += 1
                else:
                    for colliding in self.collides_with(new_bubble, rest_bub):
                        dir_vec = rest_bub[colliding, :2] - self.bubbles[i, :2]
                        norm = np.linalg.norm(dir_vec)
                        if norm == 0:
                            continue
                        dir_vec = dir_vec / norm
                        orth = np.array([dir_vec[1], -dir_vec[0]])
                        new_point1 = self.bubbles[i, :2] + orth * self.step_dist
                        new_point2 = self.bubbles[i, :2] - orth * self.step_dist
                        dist1 = self.center_distance(self.com, np.array([new_point1]))
                        dist2 = self.center_distance(self.com, np.array([new_point2]))
                        new_point = new_point1 if dist1 < dist2 else new_point2
                        new_bubble = np.append(new_point, self.bubbles[i, 2:4])
                        if not self.check_collisions(new_bubble, rest_bub):
                            self.bubbles[i, :] = new_bubble
                            self.com = self.center_of_mass()
            if moves / len(self.bubbles) < 0.05:
                self.step_dist /= 2

    def to_dataframe(self):
        return pd.DataFrame({
            'x': self.bubbles[:, 0],
            'y': self.bubbles[:, 1],
            'radius': self.bubbles[:, 2],
            'size': self.bubbles[:, 3],
            'label': self.labels,
            'color': self.colors
        })


def plot_bubble_chart_plotly(df, plot_diameter=500):
    chart = BubbleChartPlotly(
        labels=df['label'],
        area=df['size'],
        colors=df['color'],
        bubble_spacing=2,
        plot_diameter=plot_diameter
    )
    chart.collapse()
    df_bubbles = chart.to_dataframe()
    df_bubbles['size_px'] = df_bubbles['radius'] * 2

    fig = go.Figure()
    fig.add_trace(go.Scatter(
        x=df_bubbles['x'],
        y=df_bubbles['y'],
        mode='markers+text',
        marker=dict(
            size=df_bubbles['size_px'],
            color=df_bubbles['color'],
            sizemode='diameter',
            opacity=0.9,
        ),
        text=df_bubbles['size'].round(2).astype(str),
        textposition='middle center',
        textfont=dict(
            size=np.clip(df_bubbles['size'] / df_bubbles['size'].max() * 20, 5, 18)
        ),
        hovertemplate=(
            '<b>%{customdata[0]}</b><br>' +
            'Size: %{text}' +
            '<extra></extra>'
        ),
        customdata=df_bubbles[['label']],
    ))

    fig.update_layout(
        title='Bubble Chart',
        template='plotly_dark',
        xaxis=dict(visible=False),
        yaxis=dict(visible=False),
        margin=dict(l=0, r=0, t=40, b=0),
        height=plot_diameter,
        width=plot_diameter
    )

    fig.show()

n_bubbles = 40
colors = ['#00C1B2','#FF5E5B','#A28DFF','#2EC4B6','#E71D36','#FF9F1C','#8A4FFF','#00CC66' ]
df = pd.DataFrame({
    'label': [f'Item {i}' for i in range(n_bubbles)],
    'size': np.random.randint(2, 250, n_bubbles),
    'color': np.random.choice(colors, n_bubbles)
})
plot_bubble_chart_plotly(df, plot_diameter=500)