Hello,
I want to create the following kind of heatmap in Plotly.
What are the ways that I can do that?
I was wondering if I have to use shapes to do this.

Thanks & Regards,
Apurva
Hello,
I want to create the following kind of heatmap in Plotly.
What are the ways that I can do that?
I was wondering if I have to use shapes to do this.
Thanks & Regards,
Apurva
In plotly lingo, that looks more like a bubble chart to me: https://plot.ly/javascript/bubble-charts/
Hello,
Thank You for your reply.
Can I use the third dimension as a property for size of bubbles.
Size parameter in bubble chart accepts a 1-D array. But I have z parameter for all x and corresponding y values(i.e. 2D array).
Can I use that in bubble charts?
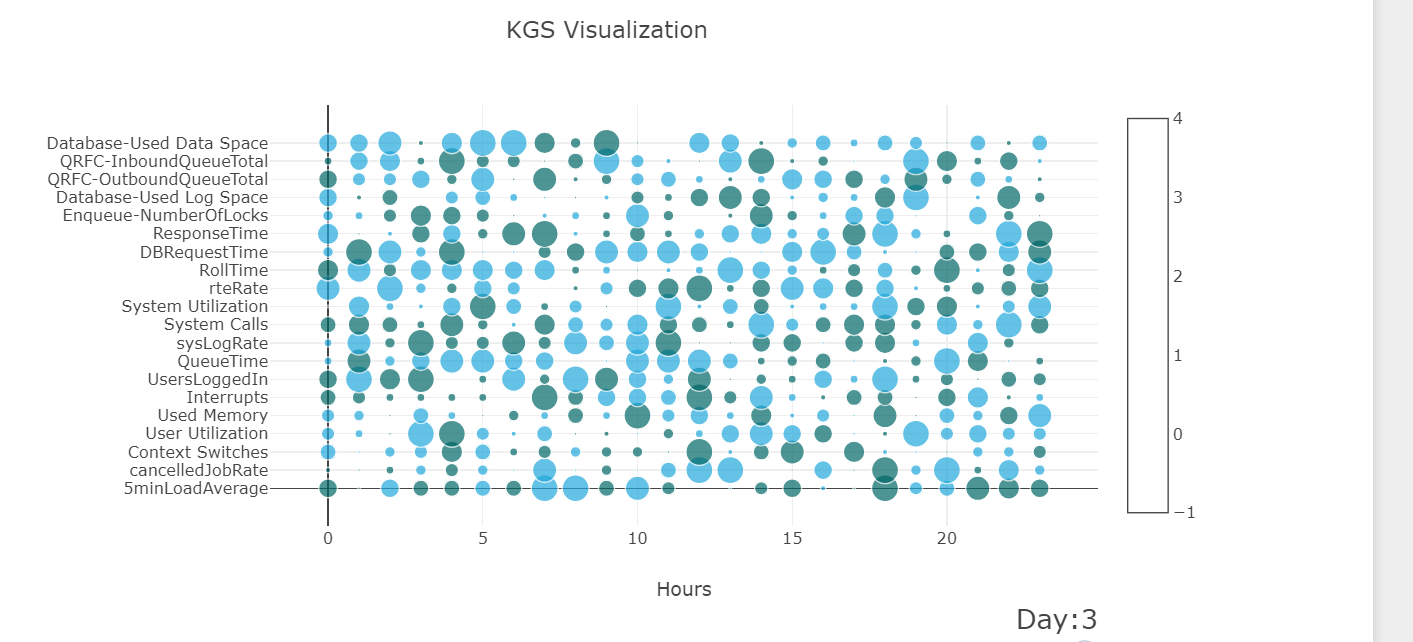
For example: My visualization looks like this:-
I want to use bubbles instead of rectangles and scale them based on score values(Blue color blocks should be larger)
Regards,
Apurva
Unfortunately, no. You’ll have to rearrange your 2D array into a long 1D array with the corresponding x and y coordinates to fill the grid.
That was really helpful.
Thank You so much.
I created this image.
I am not able to display the colorscale, after setting ‘showscale:True’.
data_dict = {

        'x': hours,
        'y': metrics,
        'mode':'markers',
        'marker' : {
                    'size': transformed_arr[0],
                    'color':colors_list[0],
                    'showscale': True
        }
}
Can you help me in displaying that.
Thank You so much for all your help.
Best Regards,
Apurva
Hello,
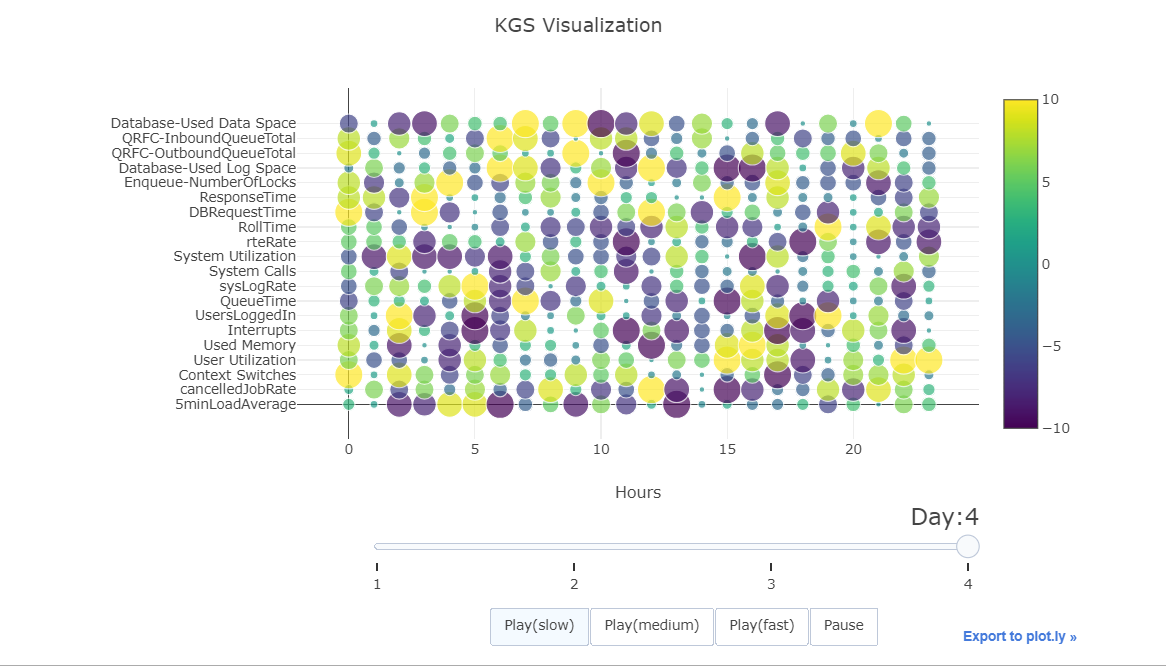
I was able to include colorscale as well.
I used the following code:
data_dict = {
‘x’: hours,
‘y’: metrics,
‘mode’:‘markers’,
‘type’:‘scatter’,
‘marker’ : {
‘color’ : transformed_arr[day],
‘size’ : abc[day],#set color equal to a variable
‘colorscale’:‘Viridis’,
‘showscale’:True,
‘cmin’ : -10,
‘cmax’ : 10
        }
        }
Thank You so much for your help.