Hello everyone,
I am trying to create a 3d scatterplot with the following script:
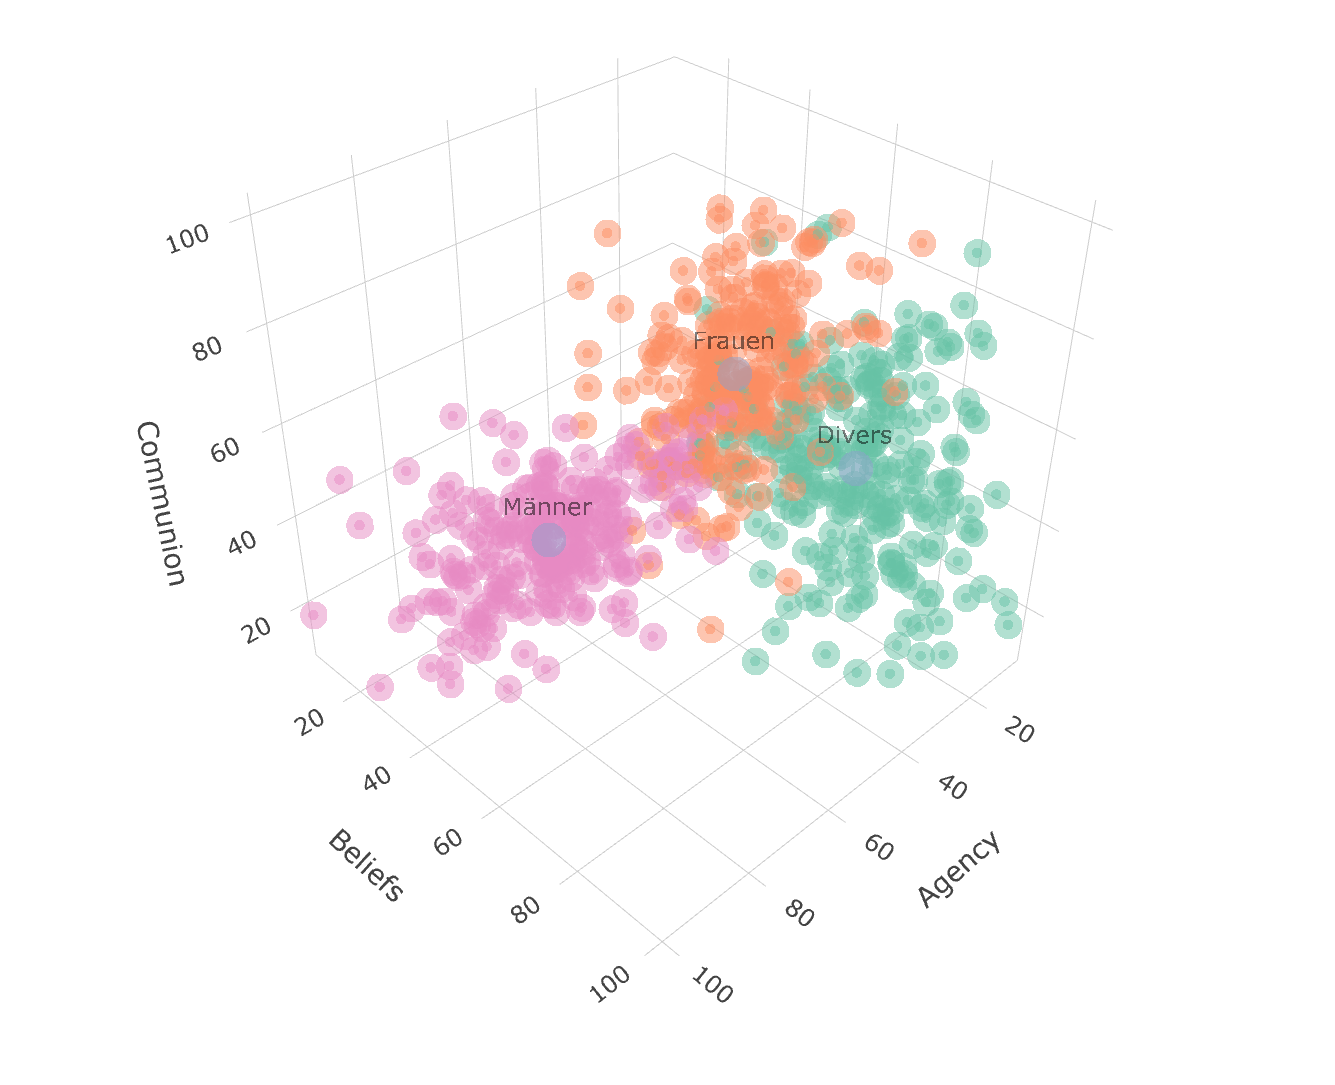
# Create scatterplot for all data points
scatterplot <- plot_ly(data = data2, x = ~A, y = ~B, z = ~C, color = ~Geschlecht, type = "scatter3d", mode = "markers", opacity =0.5) %>%
  layout(scene = list(xaxis = list(title = "Agency"),
                      yaxis = list(title = "Beliefs"),
                      zaxis = list(title = "Communion")))

# add all data points
scatterplot <- add_markers(scatterplot, data = data2, x = ~A, y = ~B, z = ~C, color = ~Geschlecht,
                           marker = list(size = 5), showlegend = FALSE)

# Add aggregated data points for averages (as text and as point)
scatterplot <- scatterplot %>%
  add_trace(data = aggregated_data, x = ~A, y = ~B, z = ~C, color = ~Geschlecht,
            type = "scatter3d", mode = "text", text = ~Geschlecht,
            textposition = "top center", textfont = list(color = "black", size = 12),
            showlegend = FALSE, visible = TRUE) %>%
  add_markers(data = aggregated_data, x = ~A, y = ~B, z = ~C, color = "black",
              marker = list(size = 10, symbol = "circle", opacity = 1, alpha = 1),
              showlegend = FALSE, visible = TRUE)

# Plot anzeigen
scatterplot
Unfortunately, the aggregated data points for the averages are 1. not black but some kind of turquoise colour and 2. not opaque, even though I set the opacity in add_markers to 1. Moreover, I noticed that whenever I change the opacity in the plotly() command, it kind of sets an overall opacity that I can’t change anymore. How can I fix this? I want to make the aggregated data points visible.
Thank you!