Hi everyone,
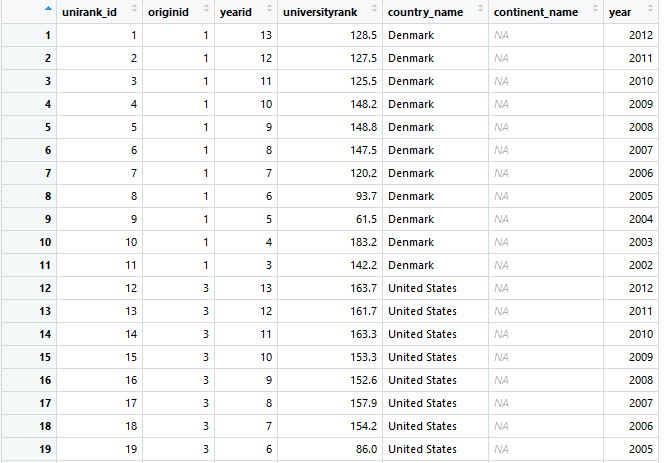
For a BI project I am using Rstudio in conjunction with a postgreSQL DB and plotly to visualise the data. However, when trying to plot linecharts from a dataframe in Rstudio, the ‘mode = ‘lines’’ will show no lines. ‘mode = markers’ shows the markers, mode = ‘lines+markers’ also only the markers. Below you can see the dataframe and code used to create the plot.

plot_ly(cube_unirank, x = ~year, y =~universityrank, type = ‘scatter’, color =~country_name, mode = ‘lines+markers’) %>%
layout(title = “average university from the Shanghai rankings”,
yaxis = list(title = "average university rank ",autorange = “reversed”),
xaxis = list(title = “Year”))
I hope someone can point us in the right direction, it seems like a very basal error but no luck for us yet. Thank you very much in advance!
