Multiple Dropdown Filter Not Plotting Correctly

Hi All,

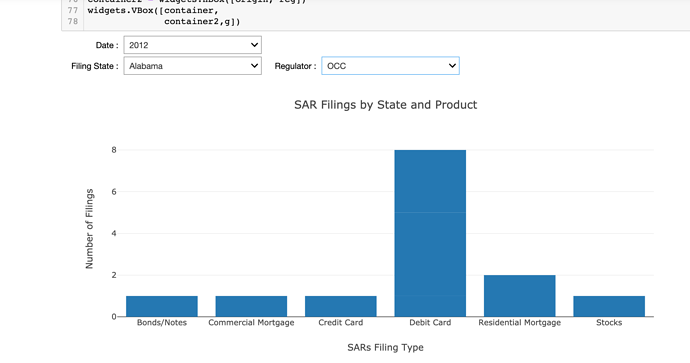
I have a simple bar-plot that uses 3 dropdown menus that while it selects data-points, it does not update/plot values correctly. For example, when I select year=2013, state=New York and regulator=SEC, it should be showing me a total of 18 but instead shows 7, stocks=11 but it shows 6ā€¦ etcā€¦ Can anyone advise on what may be wrong in the code? Sample dataset and code below. Thanks! :call_me_hand:

DummyData = https://drive.google.com/file/d/1SgaM9OKdsR1QHbp_qFw1dEOT_hc_bdeP/view?usp=sharing

use_date = widgets.Dropdown(
options=list(df['Year Month'].unique()),
description='Date : ',
value=2012,
)

container = widgets.HBox(children=[use_date])

reg = widgets.Dropdown(
options=list(df['Regulator'].unique()),
value='[Total]',
description='Regulator :',
)

origin = widgets.Dropdown(
options=list(df['State'].unique()),
value='Alabama',
description='Filing State :',
)

# Assign an emptry figure widget with two traces
trace1 = go.Bar(x=df.groupby(by="Industry").count()["Year Month"], name='SARs Filings', orientation='v')

g = go.FigureWidget(data=[trace1],
                layout=go.Layout(
                    barmode='group',
                    hovermode="closest",
                    title=dict(
                        text='SAR Filings by State and Product'
                    )
                ))

def validate():
if origin.value in df['State'].unique() and reg.value in df['Regulator'].unique() :
    return True
else:
    return False


def response(change):
if validate():
    if use_date.value:
        filter_list = [i and j and k for i, j, k in
                       zip(df['Year Month'] == use_date.value,
                           df['Regulator'] == reg.value,
                           df['State'] == origin.value)]
        
        temp_df = df[filter_list]

    else:
        filter_list = [i and j for i, j in
                       zip(df['Regulator'] == '[Total]', df['State'] == origin.value)]
        temp_df = df[filter_list]
    x = temp_df['Product']
    with g.batch_update():
        g.data[0].x = x
        g.layout.xaxis.title = 'SARs Filing Type'
        g.layout.yaxis.title = 'Number of Filings'


origin.observe(response, names="value")
reg.observe(response, names="value")
use_date.observe(response, names="value")

container2 = widgets.HBox([origin, reg])
widgets.VBox([container,
          container2,g])

@mini_geek A go.Bar instance is defined either by the list of y-values (that give the bars heights), or both x, and y values. In the latter case above each x[k] value is drawn a bar of height y[k].

To understand why your bars have unexpected height, just run the following lines of code:

fig = go.FigureWidget(go.Bar(x=[2,  5, 6]'),
                     layout=go.Layout(width=500, height=400))
fig

and you get the following fig:

bars-x

plotly.js interpreted the missing y-list as being [0, 1, 2], i.e. it plotted a bar of height 0 above x=2, height 1 above x=5, etc.

But if you define only the y list, you get the right bar heights above the default x-values, x= [0,1,2]:

fig1 = go.FigureWidget(go.Bar(y=[2,  5, 6]),
                     layout=go.Layout(width=500, height=400))
fig1

bars-y

But a more informative Bar plot is defined by both x and y lists.

fig = go.FigureWidget(go.Bar(x=['a', 'b', 'c'], y=[6,  3, 4], name='SAR'),
                     layout=go.Layout(width=500, height=400))

bars-xy

Hence in your code you should redefine trace1 inserting either the suitable y-values or both x, y values,
and within response function you should define an appropiate x and y lists or dataframe columns.

Thanks for the reply @empet.
I did try x and y values to be reflected on the trace but it doesnā€™t make a difference. The output-plot still not correct. Iā€™ve tried setting the trace grouped by x & y, not grouped by x & y as well as excluding x or y-values from the trace but without positive results. any other ideas? Thanks!

Donā€™t try empirically! Just check your code, and take into account how a right Bar plot is defined. From now on it is Python code issue not a Plotly one. Excluding y values from Bar chart, as I illustrated above is a non-sense.

Any other advise is really appreciated. Thanks! :fist:

@mini_geek

Computing the filter_list for New York state, year 2013 and regulator =ā€˜SECā€™, we get:

filter_list = [i and j and k for i, j, k in
                           zip(df['Year Month'] == 2013,
                           df['Regulator'] == 'SEC',
                           df['State'] == 'New York')]
df[filter_list]

If you are interested in the Bar chart having on xaxis the df[filter_list]['Product'] values and on yaxis
df[filter_list]['Count'], then it looks like this one:

If this is the case, I suggest to define the initial trace1 as follows:

filter_list = [i and j and k for i, j, k in
                           zip(df['Year Month'] == 2012,
                           df['Regulator'] == '[Total]',
                           df['State'] == 'Alabama')]
trace1 = go.Bar(x =df[filter_list]['Product'], y= df['filter_list]['Count'], name='SARs Filings')

Delete the line,

x=temp_df['Product]

and replace the original g.update with:

with g.batch_update():
        g.data[0].x = temp_df['Product']
        g.data[0].y = temp_df['Count']
        g.layout.xaxis.title = 'SARs Filing Type'
        g.layout.yaxis.title = 'Number of Filings'

Thanks for the feedback @empet. I tried your suggestion but it didnā€™t work on its entirety; though I used your modifications of g.batch_update , changed the trace to go.Bar(x=df.groupby("Product", sort=True).count() and that gave me the right count on all cases. However, i can only see the right plots when using the dropdowns but on default. Any ideas?

with g.batch_update():
g.data[0].x = temp_df[ā€˜Productā€™]
g.data[0].y = temp_df[ā€˜Countā€™]
g.layout.xaxis.title = ā€˜SARs Filing Typeā€™
g.layout.yaxis.title = ā€˜Number of Filingsā€™

@mini_geek, Please be more explicit, I cannot understand what you are saying by "However, i can only see the right plots when using the dropdowns but on default. ". Eventualy post a gif to understand what are you meaning by ā€œseeing the right plots on defaultā€.

Pics wouldā€™ve helped :grimacing:
If I use the dropdown, it display proper values, then if use the dropdown to go back to the default settings (2012, Alabama, OCC) it shows the correct values.

This the default image, meaning default view after running the cell.

View after using the dropdowns.

Confirmation of correct values.

20%20PM

@mini_geek mini_geek For me it works:

with your code modified I as said in a previous post:

import pandas as pd
from ipywidgets import widgets
import plotly.graph_objects as go
df =pd.read_csv('DummyData.csv')

use_date = widgets.Dropdown(
options=list(df['Year Month'].unique()),
description='Date : ',
value=2012)


regulator = list(df['Regulator'].unique())
states = list(df['State'].unique())
states.pop(2)

container = widgets.HBox(children=[use_date])

reg = widgets.Dropdown(
                options=regulator, 
                value='[Total]',
                description='Regulator :')

origin = widgets.Dropdown(
options = states,
value='Alabama',
description='Filing State :',
)

filter_list = [i and j and k for i, j, k in
                           zip(df['Year Month'] == 2012,
                           df['Regulator'] == '[Total]',
                           df['State'] == 'Alabama')]
# Assign an emptry figure widget with two traces
#trace1 = go.Bar(x=df.groupby(by="Industry").count()["Year Month"], name='SARs Filings', orientation='v')
trace1 = go.Bar(x= df[filter_list]['Product'], y=df[filter_list]['Count'])
g = go.FigureWidget(data=[trace1],
                layout=go.Layout(width=600, height=400, font_size=11,
                    barmode='group',
                    hovermode="closest",
                    title=dict(
                        text='SAR Filings by State and Product'
                    )
                ))

def validate():
    if origin.value in df['State'].unique() and reg.value in df['Regulator'].unique() :
        return True
    else:
        return False


def response(change):
    if validate():
        if use_date.value:
            filter_list = [i and j and k for i, j, k in
                           zip(df['Year Month'] == use_date.value,
                           df['Regulator'] == reg.value,
                           df['State'] == origin.value)]
        
        temp_df = df[filter_list]

    else:
        filter_list = [i and j for i, j in
                       zip(df['Regulator'] == '[Total]', df['State'] == origin.value)]
        temp_df = df[filter_list]
        
    
    with g.batch_update():
        g.data[0].x = temp_df['Product']
        g.data[0].y = temp_df['Count']
        g.layout.xaxis.title = 'SARs Filing Type'
        g.layout.yaxis.title = 'Number of Filings'
     

origin.observe(response, names="value")
reg.observe(response, names="value")
use_date.observe(response, names="value")

container2 = widgets.HBox([origin, reg])
widgets.VBox([container,
              container2,g])

hmmā€¦ Thanks, iā€™ll recheck my code.

@mini_geek Comparing bar colors in my plots and in yours, it seems that you are using an older Plotly version.

I have Plotly 4.1.0.

@empet I do bc Jupyterlab still pretty buggy.

can you guys help me with my data set

@Suchi You have to specify what youā€™re looking for to get done.

Just have a look into my data-set
I want Equipment Name in my drop-down widgets and when i select a particular equipment name it should show me that specific equipment according to the date give
if you can visit my query that i have written it would be great.

@Suchi whereā€™s the dataset?

visit here
and i just want one dropdown
im getting the output but my dropdown is not interacting with graph

Now this is my code which is giving me the output but not interacting with each other

eq_name = list(df[ā€˜Equipment Nameā€™].unique().tolist())

eqq_name = widgets.Dropdown(
options=eq_name,
value=ā€˜BELT CONVEYOR 4 Top rotaryā€™,
description='Equipment Name : ')
filter_list = [i for i in # zip(df[ā€˜Dateā€™] == use_date.value,
zip(df[ā€˜Equipment Nameā€™] == eqq_name.value)]
Month"], name=ā€˜SARs Filingsā€™, orientation=ā€˜vā€™)
trace= go.Scatter(x= df[ā€˜Dateā€™], y=df[ā€˜STOCKā€™],hovertext=df[ā€˜Equipment Nameā€™])

g = go.FigureWidget(data=[trace],

            )

def validate():
if eq_name in df[ā€˜Equipment Nameā€™].unique() :
return True
else:
return False

def response(change):
if validate():
if use_date.value:
filter_list = [i for i in zip(df[ā€˜Dateā€™] == use_date.value,
zip(df[ā€˜Equipment Nameā€™] == eqq_name.value))]
else:
filter_list = [i for i, in zip(kiln[ā€˜Equipment Nameā€™] == eqq_name.value)]
temp_df = df[filter_list]

container2 = widgets.HBox([eqq_name])

widgets.VBox([container2,g])

@Suchi At first glance the code you pasted on the last message is incomplete, and on the first link you provided, quotations marks are mismatched, lines missing parenthesis, thereā€™s indentation where not needed and a couple other details. I suggest carefully writing (instead of copy/paste) in a new cell or notebook the piece of code youā€™re trying to replicate.