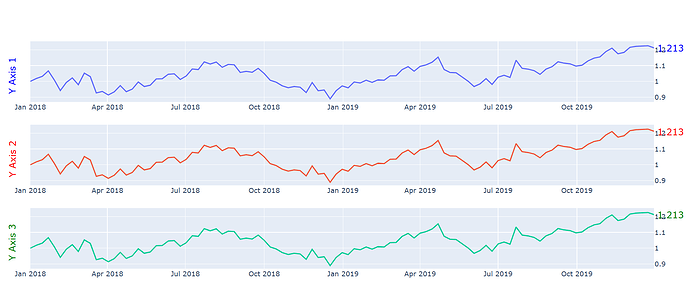
Move y tick value to right while keeping title on the left

Hello! I have created one subplots (3 rows and 1 col), and I want to move all y axis value to right side while keep y axis title on the left (the example: Dropbox). I have tried

fig.update_yaxes(side="right", row=1, col=1)
fig.update_yaxes(title_standoff=25, row=1, col=1)

But the title never move to left. How can I fix it? Thanks!

Hi @JackTang ,

How about hide the original y axis title and use annotations as new y axis title on the left side.

import plotly.express as px
import numpy as np

df = px.data.stocks()
fig = px.line(df, x='date', y="GOOG")

last_point = round(df["GOOG"].values[-1],4)
median = np.median(df["GOOG"].values)

annotations = []

# Last point
annotations.append(dict(
        xref='paper',
        x=1.05,
        y=last_point,
        xanchor='right', 
        yanchor='middle',
        text='{}'.format(last_point), 
        showarrow=False,
        font=dict(size=16,color='red')
        ))

# Left Y axis title
annotations.append(dict(
        xref='paper',
        x=-0.04,
        y=median,
        xanchor='left', 
        yanchor='middle',
        textangle=-90,
        text='{}'.format("New Y Axis Title"), 
        showarrow=False,
        font=dict(size=16,color='red')
        ))


fig.update_layout(showlegend=False, annotations=annotations)

fig.update_yaxes(side="right", title_text="")


fig.show()
1 Like

Hello @farispriadi ! Thanks for the solution, it is really amazing! And do you know how to connect the annotation with subplot? I added row and col attributes, and it didn’t work.

Hi @JackTang ,

You can set specific axis reference on annotation using yref or xref.
Based on the previous example I just set the xref="paper" for all subplot.

By setting specific yref based on the yaxis at every subplot which are y,y2,y3,y3... .
You can put annotation based on points on every subplots.

import plotly.express as px
import plotly.graph_objects as go
import numpy as np
from plotly.subplots import make_subplots

df = px.data.stocks()

fig = make_subplots(rows=3, cols=1)

fig.add_trace(
    go.Scatter(x=df['date'], y=df["GOOG"]),
    row=1, col=1
)
fig.add_trace(
    go.Scatter(x=df['date'], y=df["GOOG"]),
    row=2, col=1
)
fig.add_trace(
    go.Scatter(x=df['date'], y=df["GOOG"]),
    row=3, col=1
)

last_point = round(df["GOOG"].values[-1],4)
median = np.median(df["GOOG"].values)

annotations = []

# Last point
annotations.append(dict(
        xref='paper',
        yref='y',
        x=1.05,
        y=last_point,
        xanchor='right', 
        yanchor='middle',
        text='{}'.format(last_point), 
        showarrow=False,
        font=dict(size=16,color='blue')
        ))

# Left Y axis title
annotations.append(dict(
        xref='paper',
        yref='y',
        x=-0.04,
        y=median,
        xanchor='left', 
        yanchor='middle',
        textangle=-90,
        text='{}'.format("Y Axis 1"), 
        showarrow=False,
        font=dict(size=16,color='blue')
        ))

# Last point 2
annotations.append(dict(
        xref='paper',
        yref='y2',
        x=1.05,
        y=last_point,
        xanchor='right', 
        yanchor='middle',
        text='{}'.format(last_point), 
        showarrow=False,
        font=dict(size=16,color='red')
        ))

# Left Y axis title 2
annotations.append(dict(
        xref='paper',
        yref='y2',
        x=-0.04,
        y=median,
        xanchor='left', 
        yanchor='middle',
        textangle=-90,
        text='{}'.format("Y Axis 2"), 
        showarrow=False,
        font=dict(size=16,color='red')
        ))

# Last point 3
annotations.append(dict(
        xref='paper',
        yref='y3',
        x=1.05,
        y=last_point,
        xanchor='right', 
        yanchor='middle',
        text='{}'.format(last_point), 
        showarrow=False,
        font=dict(size=16,color='green')
        ))

# Left Y axis title 3
annotations.append(dict(
        xref='paper',
        yref='y3',
        x=-0.04,
        y=median,
        xanchor='left', 
        yanchor='middle',
        textangle=-90,
        text='{}'.format("Y Axis 3"), 
        showarrow=False,
        font=dict(size=16,color='green')
        ))

fig.update_layout(showlegend=False, annotations=annotations)
fig.update_yaxes(title_text="",side="right", row=1, col=1)
fig.update_yaxes(title_text="", side="right",row=2, col=1)
fig.update_yaxes(title_text="", side="right",row=3, col=1)

fig.show()
1 Like

Thanks for the explanation @farispriadi! it works great!

1 Like

Hello @farispriadi,

I add last point annotation of two lines as below

        annotations = []
        # Last points in first subplot
        for c, last_point_val in last_points:
            annotations.append(dict(
                        xref='paper',
                        yref='y',
                        x=1.072,
                        y=last_point_val,
                        xanchor='right', 
                        yanchor='middle',
                        text=f'+{(last_point_val * 100):.2f}%', 
                        showarrow=False,
                        font=dict(size=10, color='white'),
                        bgcolor=c,
                        opacity=0.8,
                        borderwidth=0,
                        borderpad=4,
                        align='center'
                    ))

And I find that the x offset of last annotation is becoming bigger as the attachment (Dropbox) shown. Do you know how to fix it?

Hi @JackTang ,

I think the difference x offset between two last points was because the xanchor is set right.
So the position of x=1.072 is set to the right side of annotation.

You can fix that by setting xanchor="left" and reduce x value, for example x=1.032 or smaller value if your annotation’s position too right.

annotations = []
        # Last points in first subplot
        for c, last_point_val in last_points:
            annotations.append(dict(
                        xref='paper',
                        yref='y',
                        x=1.032,  # reduce start posistion of left side of annotation
                        y=last_point_val,
                        xanchor='left', #change xanchor to 'left' 
                        yanchor='middle',
                        text=f'+{(last_point_val * 100):.2f}%', 
                        showarrow=False,
                        font=dict(size=10, color='white'),
                        bgcolor=c,
                        opacity=0.8,
                        borderwidth=0,
                        borderpad=4,
                        align='center'
                    ))

Brilliant! :+1: