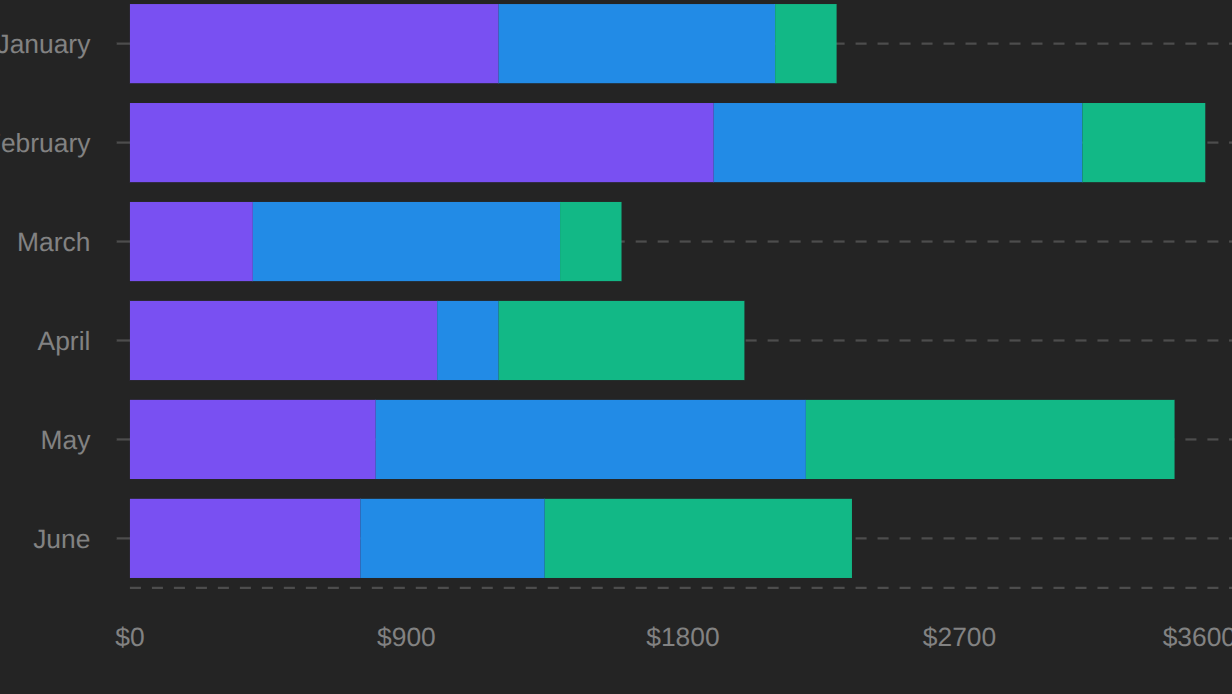
Some Dash Mantine charts, e.g. the line chart, take a valueFormatter argument. This argument is a JavaScript function that takes y-axis tick and tooltip values and returns formatted strings. As far as I can tell, there is no equivalent for x-axis tick values.
The equivalent Recharts props seem to be XAxis -> tickFormatter and YAxis -> tickFormatter. I tried to pass xAxisProps = {"tickFormatter": "() => 'test'"} and xAxisProps = {"tickFormatter": {"function": "myFormattingFunction"}} but this does not seem to be supported.
Is it possible to format x and y tick labels independently? If not, is this on the DMC road map, or is this a problem with Mantine charts?
Note that I can not format my data before passing it to the chart constructor (I am using a BarChart wich orientation=vertical and I need to format the labels on the vertical axis without changing the tooltip content).