Master Detail AG-Grid with Markdown Component

Hello Everyone!

I would like to know how to combine 2 different parts of the Dash AG Grid tutorial. I am wanting to create an AG Grid instance that uses Master Detail (the version that is NOT doing an aggregation just like the first example shown here: Master Detail | Dash for Python Documentation | Plotly).

Given that simple example, how could someone add the ability to use Markdown inside the Detail grid (like how it works here: Markdown Component | Dash for Python Documentation | Plotly)? Defining it under the columnDefs (detailColumnDefs in the example) doesn’t seem to work like it would normally.

I believe if I am able to understand how including Markdown works, then I can also get custom cell renders to work (similar to example 3 here: https://dash.plotly.com/dash-ag-grid/cell-renderer-components)

Thanks for any support!

Hello @robertf,

Welcome for the community!

If possible, could you post what you’ve tried?

Thanks for the welcome!

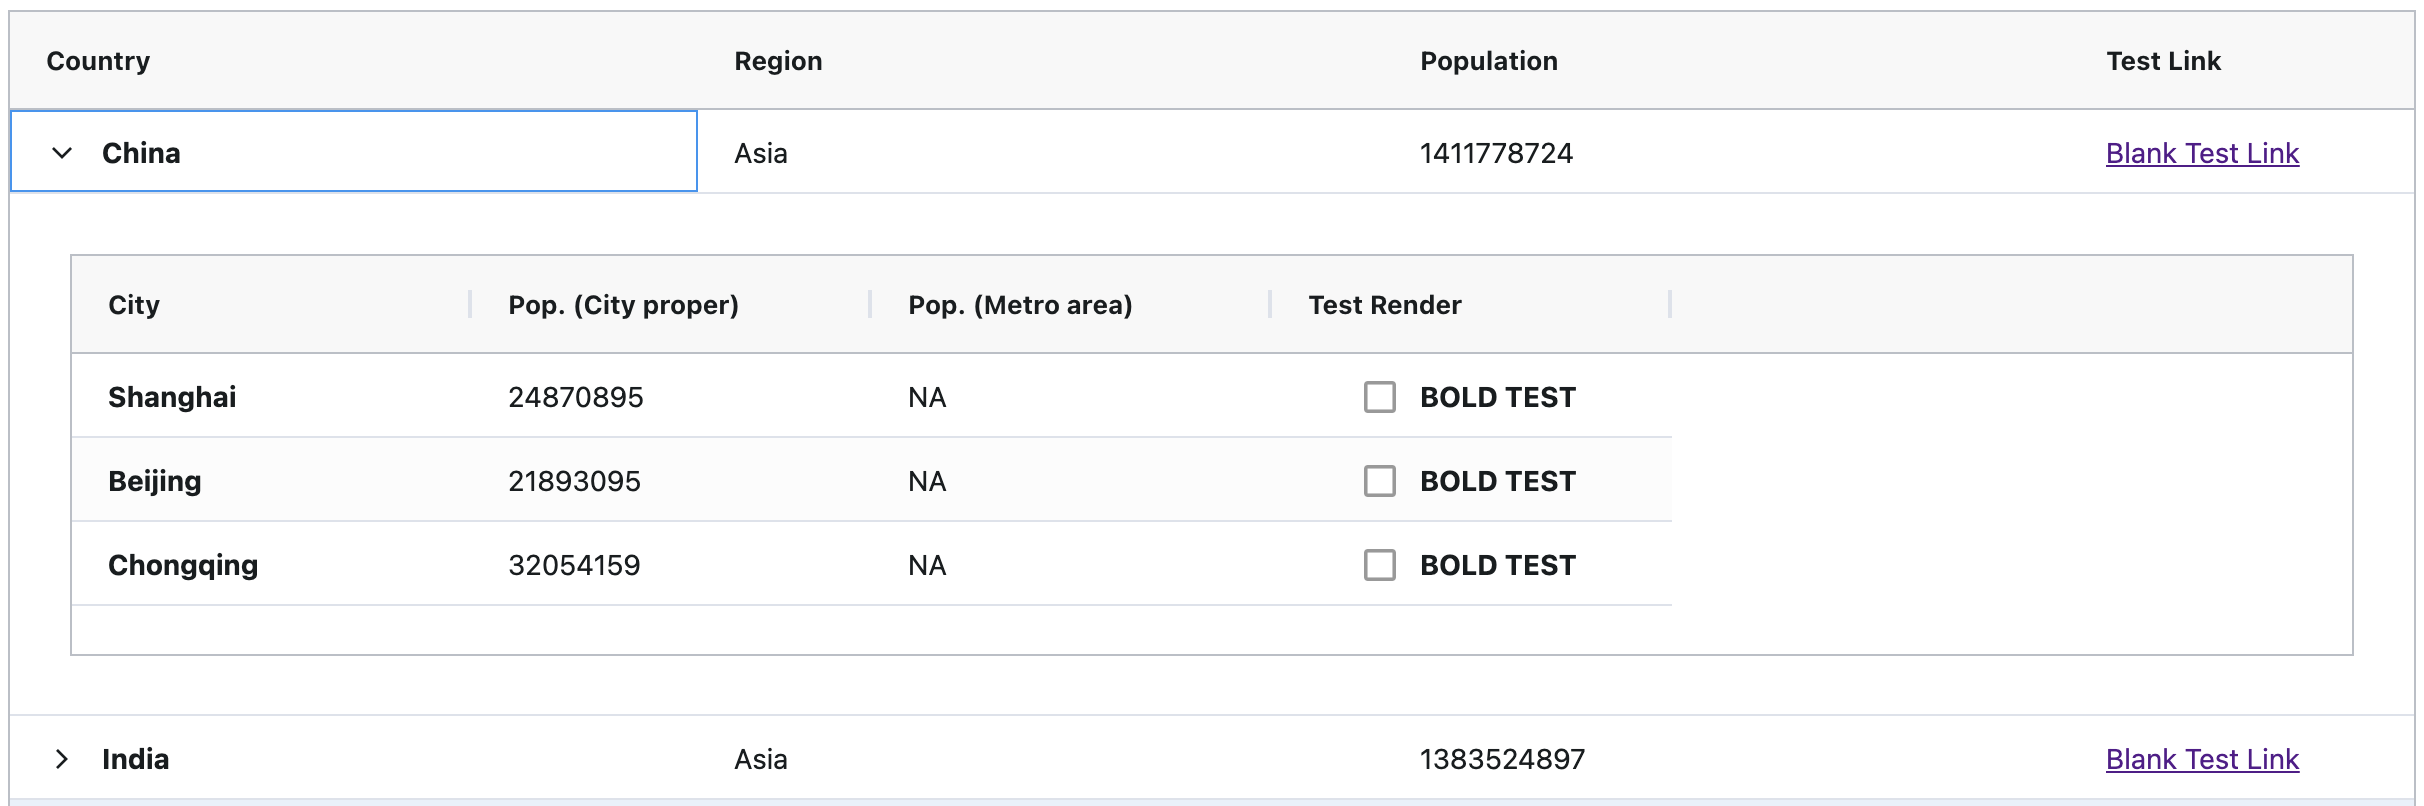
Below I have what I tried. You’ll see that for testing, I am trying to get some cell values to be bold. (I actually want to do something else, but bolding with Markdown is the easiest.) I tried combining multiple things I’ve read about renderers, but nothing I do seems to work on the Detail grid.

I have a feeling the answer might be here, but I don’t understand AG-Grid and Dash enough to really know: React Data Grid: Custom Detail

from dash import Dash, html
import dash_ag_grid as dag

import os

app = Dash(__name__)

masterColumnDefs = [
    {
        "headerName": "Country",
        "field": "country",
        "cellRenderer": "agGroupCellRenderer",
        "cellRendererParams": {
            'innerRenderer': "markdown",
        },
    },
    {
        "headerName": "Region", 
        "field": "region"
    },
    {
        "headerName": "Population",
        "field": "population"
    },
    {
        "headerName": "Test Link",
        "field": "test_link",
        "cellRenderer": "markdown",
    },
]
detailColumnDefs = [
    {
        "headerName": "City", 
        "field": "city",
        "resizable": True,
        "cellRenderer": "markdown"
    },
    {
        "headerName": "Pop. (City proper)", 
        "field": "population_city",
        "resizable": True,
    },
    {
        "headerName": "Pop. (Metro area)",
        "field": "population_metro",
        "resizable": True,
    },
    {
        "headerName": "Test Render",
        "field": "test_render",
        "resizable": True,
        "cellRenderer": "agGroupCellRenderer",
        "cellRendererParams": {
            'checkbox': True,
            'innerRenderer': "markdown",
        },
    }
]
rowData = [
    {
        "country": "**China**",
        "region": "Asia",
        "population": 1411778724,
        "test_link":"[Blank Test Link](/)",
        "cities": [
            {
                "city": "**Shanghai**",
                "population_city": 24870895,
                "population_metro": "NA",
                "test_render": "**BOLD TEST**"
            },
            {
                "city": "**Beijing**",
                "population_city": 21893095,
                "population_metro": "NA",
                "test_render": "**BOLD TEST**"
            },
            {
                "city": "**Chongqing**",
                "population_city": 32054159,
                "population_metro": "NA",
                "test_render": "**BOLD TEST**"
            },
        ],
    },
    {
        "country": "**India**",
        "region": "Asia",
        "population": 1383524897,
        "test_link":"[Blank Test Link](/)",
        "cities": [
            {
                "city": "**Delhi**",
                "population_city": 16753235,
                "population_metro": 29000000,
                "test_render": "**BOLD TEST**"
            },
            {
                "city": "**Mumbai**",
                "population_city": 12478447,
                "population_metro": 24400000,
                "test_render": "**BOLD TEST**"
            },
            {
                "city": "**Kolkata**",
                "population_city": 4496694,
                "population_metro": 14035959,
                "test_render": "**BOLD TEST**"
            },
        ],
    },
    {
        "country": "**United States**",
        "region": "Americas",
        "population": 332593407,
        "test_link":"[Blank Test Link](/)",
        "cities": [
            {
                "city": "**New York**",
                "population_city": 8398748,
                "population_metro": 19303808,
                "test_render": "**BOLD TEST**"
            },
            {
                "city": "**Los Angeles**",
                "population_city": 3990456,
                "population_metro": 13291486,
                "test_render": "**BOLD TEST**"
            },
            {
                "city": "**Chicago**",
                "population_city": 2746388,
                "population_metro": 9618502,
                "test_render": "**BOLD TEST**"
            },
        ],
    },
    {
        "country": "**Indonesia**",
        "region": "Asia",
        "population": 271350000,
        "test_link":"[Blank Test Link](/)",
        "cities": [
            {
                "city": "**Jakarta**",
                "population_city": 10154134,
                "population_metro": 33430285,
                "test_render": "**BOLD TEST**"
            },
        ],
    },
]


app.layout = html.Div(
    [
        dag.AgGrid(
            id="simplified-master-detail-example",
            enableEnterpriseModules=True,
            licenseKey=os.environ["AGGRID_ENTERPRISE"],
            columnDefs=masterColumnDefs,
            rowData=rowData,
            columnSize="sizeToFit",
            masterDetail=True,
            detailCellRendererParams={
                "detailGridOptions": {
                    "columnDefs": detailColumnDefs,
                },
                "detailColName": "cities",
                "suppressCallback": True,
            },
            dashGridOptions={"detailRowAutoHeight": True},
        ),
    ]
)


if __name__ == "__main__":
    app.run(host="127.0.0.1", debug=True)

@robertf,

You found a bug, please post an issue here:

Thanks! I will post an issue.
Is this the location of the bug (using the City column as an example)? This seems like the spot where the Detail columns would get to have their cellRenderer defined.

detailColumnDefs = [
    {
        "headerName": "City", 
        "field": "city",
        "resizable": True,
        "cellRenderer": "markdown"
    },
   ..........
]

Nope, the issue is that the components for the overall grid are not going down to the next level(s). :slight_smile:

By any chance do you know of a work around for this? Or is this issue to large to have a temporary fix?

I dont know if you can have a workaround, this issue is within the grid itself and how it works.

I tried passing components down to the next level, but functions are not turned on for it.

Oh its no problem. Thanks for looking into this!

1 Like

Thanks again for fixing this issue. I wanted to follow up here to show that the test case I provided, does work as expected. Any idea on when this will make it into an official release?

Sorry, no idea right now.

Probably will fix the other open PR and maybe take a look at the couple of other open issues.


Also, this will be auto included with the bump to AG Grid v30, whenever we get the docs working with the new inferred columns.

Alright that sounds good!

I was testing something else out with the detail grid. I can’t to get cellValueChanged to fire for detail grids. Is this a bug or does something else need to be done to get this to work? I used a modified example of Master Detail | Dash for Python Documentation | Plotly [Callback with Nested Grids] since I couldn’t find anything else referencing callbacks.

from dash import Dash, html, Input, Output, callback
import dash_ag_grid as dag
import json

import os

import time

app = Dash(__name__)
masterColumnDefs = [
    {
        "headerName": "Country",
        "field": "country",
        "cellRenderer": "agGroupCellRenderer",
    },
    {"headerName": "Region", "field": "region", "editable":True},
    {"headerName": "Population", "field": "population"},
]

detailColumnDefs = [
    {"headerName": "City", "field": "city", "editable":True},
    {"headerName": "Pop. (City proper)", "field": "population_city", "editable":True},
    {"headerName": "Pop. (Metro area)", "field": "population_metro", "editable":True},
]

rowData = [
    {
        "country": "China",
        "region": "Asia",
        "population": 1411778724,
        "cities": [
            {"city": "Shanghai", "population_city": 24870895, "population_metro": "NA"},
            {"city": "Beijing", "population_city": 21893095, "population_metro": "NA"},
            {
                "city": "Chongqing",
                "population_city": 32054159,
                "population_metro": "NA",
            },
        ],
    },
    {
        "country": "India",
        "region": "Asia",
        "population": 1383524897,
        "cities": [
            {
                "city": "Delhi",
                "population_city": 16753235,
                "population_metro": 29000000,
            },
            {
                "city": "Mumbai",
                "population_city": 12478447,
                "population_metro": 24400000,
            },
            {
                "city": "Kolkata",
                "population_city": 4496694,
                "population_metro": 14035959,
            },
        ],
    },
    {
        "country": "United States",
        "region": "Americas",
        "population": 332593407,
        "cities": [
            {
                "city": "New York",
                "population_city": 8398748,
                "population_metro": 19303808,
            },
            {
                "city": "Los Angeles",
                "population_city": 3990456,
                "population_metro": 13291486,
            },
            {
                "city": "Chicago",
                "population_city": 2746388,
                "population_metro": 9618502,
            },
        ],
    },
    {
        "country": "Indonesia",
        "region": "Asia",
        "population": 271350000,
        "cities": [
            {
                "city": "Jakarta",
                "population_city": 10154134,
                "population_metro": 33430285,
            },
        ],
    },
]


app.layout = html.Div(
    [   html.Div('TEMP', id='test'),
     
        dag.AgGrid(
            enableEnterpriseModules=True,
            licenseKey=os.environ["AGGRID_ENTERPRISE"],
            id="nested-grid-detail-table-request-2",
            columnDefs=masterColumnDefs,
            rowData=rowData,
            columnSize="sizeToFit",
            masterDetail=True,
            detailCellRendererParams={
                "detailGridOptions": {
                    "columnDefs": detailColumnDefs,
                },
                "suppressCallback": False,
            },
            dashGridOptions={"detailRowAutoHeight": True},
        ),
    ]
)


@callback(
    Output("nested-grid-detail-table-request-2", "getDetailResponse"),
    Input("nested-grid-detail-table-request-2", "getDetailRequest"),
    prevent_initial_call=True,
)
def handle_request(request):
    time.sleep(1)
    return request["data"]["cities"]


@callback(
    Output("test", "children"),
    Input("nested-grid-detail-table-request-2", 'cellValueChanged'),
    prevent_initial_call=True,
)
def temp(data):
    return json.dumps(data)


if __name__ == "__main__":
    app.run(debug=True)

It’s a completely different grid, you might be able to wrangle up something using the grid’s api in order to use a setProps or… you could use cellRenderers and utilize the cellRendererData.