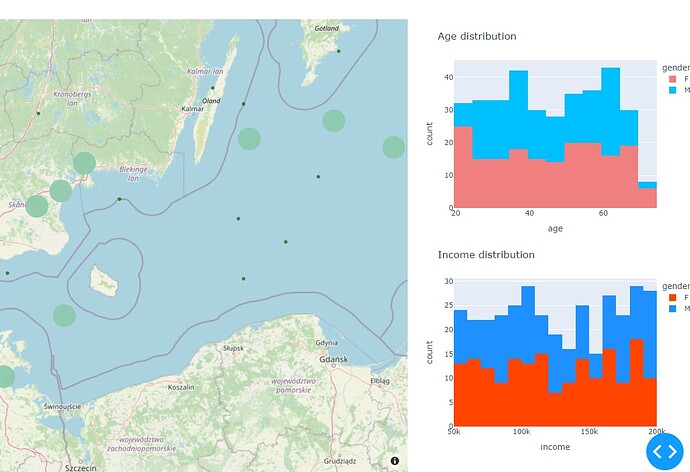
Hi. I am building a simple app with a map and two histograms next to it. The map shows the locations of people and histograms show their age and income distributions. The coordinates are randomly generated, that’s why some of them appear in the sea.
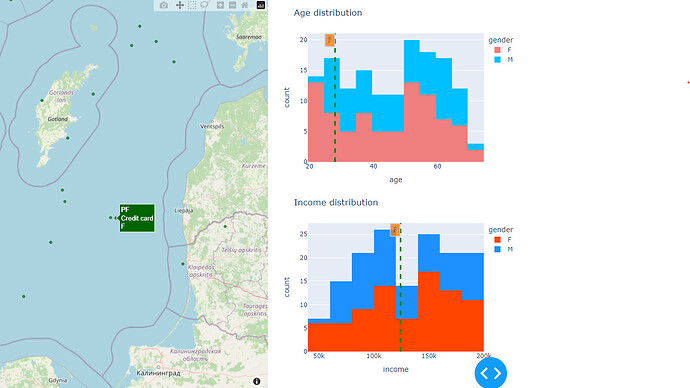
My main goal is to update histograms while I am hovering over points on the map. When I place the mouse on one point, a vertical line is added on the histogram. I have been able to do this so far and the app works as I’m expecting.
However, when I enable clustering, this property does not work (it is not responsive). Below is my code without clustering:
# Map figure

def main_map(df):

    customdata = list(
        zip(
            df["column1"],
            df["column2"],
            df["column3"],
            df["gender"],
            df['age'],
            df['income']

        ))

    mapbox_figure = dict(
        type="scattermapbox",
        lat=df["latitude"],
        lon=df["longitude"],
        marker=dict(size=7, opacity=0.7, color="#006400"),
        #cluster=dict(color='#8BC8AA',opacity=0.9),
        customdata=customdata,
        hovertemplate=
        "<b>%{customdata[1]}</b><br>"
        "%{customdata[2]}<br>"
        "%{customdata[3]}"
        "<extra></extra>",
    )

    layout = dict(
        mapbox=dict(
            style="open-street-map",
            uirevision=True,
            zoom=6,
            center=dict(
                lon=12.00,
                lat=57.67,
            ),
        ),

        margin=dict(l=0, t=0, b=0, r=0),
        height=780,
        showlegend=False,
        hovermode="closest"

    )

    figure = {"data": [mapbox_figure], "layout": layout}

    return figure
And the corresponding callback to update the histograms
@app.callback(
    Output("age", "figure"),
    Output("income", "figure"),
    Input("map", "hoverData"),
    prevent_initial_call=True,
)
def update_hist(hoverData):
    gender = hoverData["points"][0]["customdata"][3]
    age = hoverData["points"][0]["customdata"][4]
    income = hoverData["points"][0]["customdata"][5]

    dff = df[df["country"] == hoverData["points"][0]["customdata"][0]]
    return graphs.age_hist(dff, age, gender), graphs.inc_hist(
        dff, income, gender
    )
When I remove the comment from the line cluster=dict(color='#8BC8AA',opacity=0.9) hoverData property seems not working properly. Can someone explain how I can do this task while having clustering enabled?
Below is the snapshot of the app that works well without clustering being enabled.

