Hi @Emmanuelle and @adamschroeder,
Thanks again for your help here but it turns out px.strip is not exactly what I want because the density is not represented. I have a fair number of data points so it might be a bit harder I think with px.strip. I have an example below that shows how it would look plotting with geom_sina in R

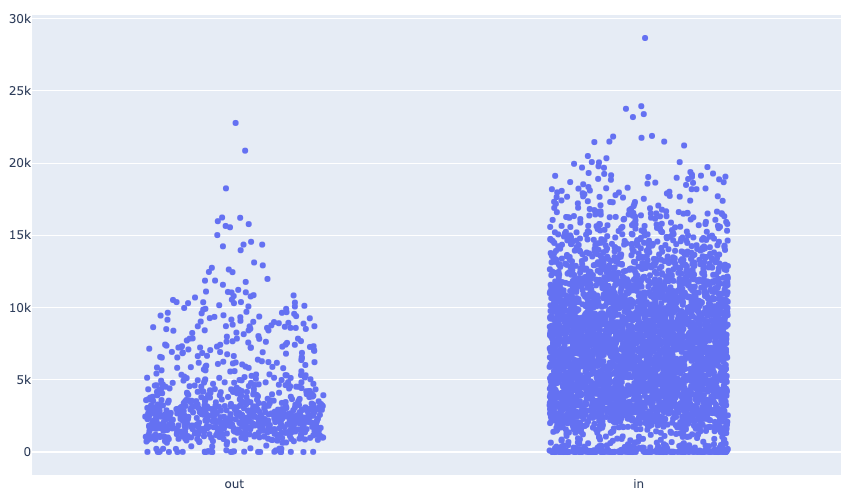
vs. px.strip in python using
fig = px.strip(df, x = "xlab", y="ylab").update_traces(jitter = 0.9)