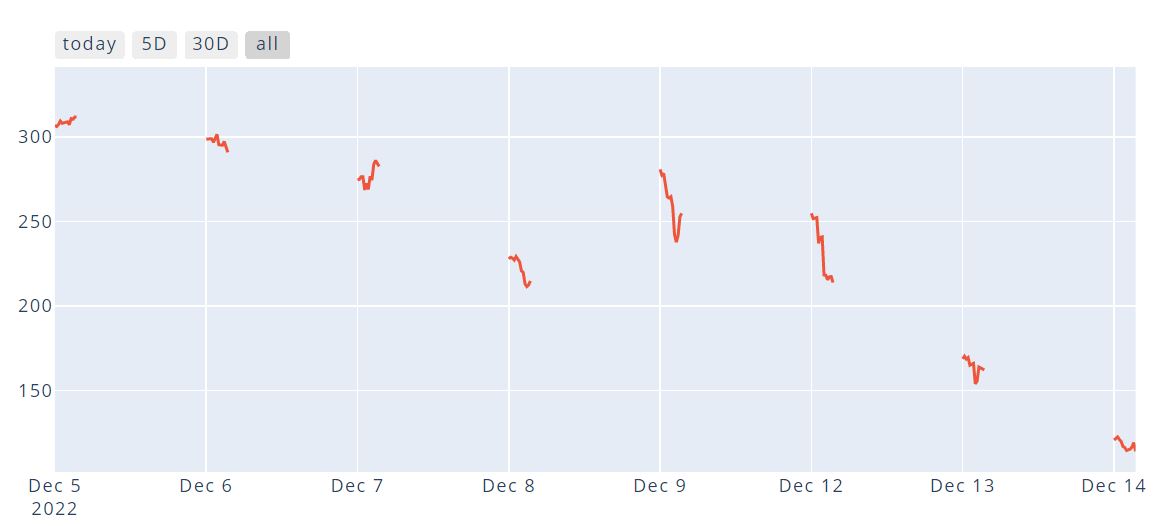
HI, I’ve a dash app that updates the graph dynamically when user submits the button. The data is stock market related and has breaks on weekends and night. TO handle this I’ve added range breaks. But, I’m finding an issue where line graph is broken and displays only when data is present as shown in the image.
How to get continuous line in this graph?
Code
dcc.Graph( id=‘straddle-graph-id’, figure=px.line(render_mode=‘svg’))
@app.callback(
Output(‘straddle-graph-id’, ‘figure’),
Input(component_id=‘add-button-state’, component_property=‘n_clicks’)
State(‘straddle-graph-id’, ‘figure’)
def update_chart(n_clicks,fig)
chart = go.Figure(fig)
line = go.Scatter(x=df['time'], y=df['price'], mode='lines',name=strike,)
chart.add_trace(line)
chart.update_xaxes(
    rangeselector=dict(
        buttons=list([
            dict(count=1, label="today", step="day", stepmode="backward"),
            dict(count=5, label="5D",    step="day", stepmode="backward"),
            dict(count=30, label="30D",  step="day", stepmode="backward"),
            dict(step="all")
        ])
    ),
    rangebreaks=[
        dict(bounds=["sat", "mon"]), #hide weekends
        dict(bounds=[16, 9], pattern="hour"), #hide hours outside of 9am-4pm
    ]
)
return chart


