closes #915
closes #800
This pull request allows for the use html tags in ma…rkdown text.
As discussed [here in in #915](https://github.com/plotly/dash-table/issues/915#issuecomment-866281607) DataTable uses Remarkable for its markdown and the default is set to disable html input, probably to reduce XSS vulnerabilities. This PR adds the `html` option to `markdown_options` prop to make it possible to "opt in" and allow html in markdown.
I found [this reported security issue](https://snyk.io/vuln/SNYK-JS-REMARKABLE-174641) with Remarkable which was fixed in 2019 in version 1.7.2. DashTable currently uses version ^2.0.1. I'm not sure I understand the XSS risks -- I think this would be a good topic to include in the docs. Would there be less risk if the markdown columns are not editable when html is allowed?
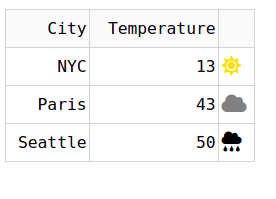
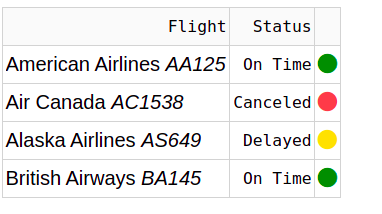
Also for the docs, [here](https://daringfireball.net/projects/markdown/syntax#html) is some good info about using html with markdown, and below are 3 examples to show some of the new features:
- Using Font Awesome icons
- Changing the color of icons with conditional formatting
- Using html to format text
- Including images in markdown
--------------
### Examples
**Font Awesome Icons `<i>`**

```
import dash
import dash_html_components as html
import dash_table
import pandas as pd
FONT_AWESOME = "https://use.fontawesome.com/releases/v5.10.2/css/all.css"
clouds = '<i class="fa fa-cloud" style="color: grey;"></i>'
rain = '<i class="fa fa-cloud-rain"></i>'
sun = '<i class="fa fa-sun" style="color: gold;"></i>'
app = dash.Dash(__name__, external_stylesheets=[FONT_AWESOME])
df = pd.DataFrame(
dict(
[
("temperature", [13, 43, 50]),
("city", ["NYC", "Paris", "Seattle"]),
("icon", [sun, clouds, rain]),
]
)
)
app.layout = html.Div(
[
dash_table.DataTable(
css=[dict(selector="p", rule="margin: 0px;")],
data=df.to_dict("records"),
columns=[
{"id": "city", "name": "City"},
{"id": "temperature", "name": "Temperature"},
{"id": "icon", "name": "", "presentation": "markdown"},
],
markdown_options={"html": True},
style_table={"width": 200},
)
]
)
if __name__ == "__main__":
app.run_server(debug=True)
```
---
**Change Color of Icons with Conditional Formatting
Formatting text with html**

```
import dash
import dash_html_components as html
import dash_table
import pandas as pd
FONT_AWESOME = "https://use.fontawesome.com/releases/v5.10.2/css/all.css"
dot = '<i class="fa fa-circle" ></i>'
app = dash.Dash(__name__, external_stylesheets=[FONT_AWESOME])
df = pd.DataFrame(
dict(
[
(
"flight",
[
"American Airlines <em>AA125</em>",
"Air Canada <em>AC1538</em>",
"Alaska Airlines <em>AS649</em>",
"British Airways <em>BA145</em>",
],
),
("status", ["On Time", "Canceled", "Delayed", "On Time"]),
("icon", [dot, dot, dot, dot]),
]
)
)
app.layout = html.Div(
[
dash_table.DataTable(
css=[dict(selector="p", rule="margin: 0px;")],
data=df.to_dict("records"),
columns=[
{"id": "flight", "name": "Flight", "presentation": "markdown"},
{"id": "status", "name": "Status"},
{"id": "icon", "name": "", "presentation": "markdown"},
],
markdown_options={"html": True},
style_table={"width": 200},
style_data_conditional=[
{
"if": {
"filter_query": '{status} = "Canceled"',
"column_id": "icon",
},
"color": "tomato",
},
{
"if": {"filter_query": '{status} = "Delayed"', "column_id": "icon"},
"color": "gold",
},
{
"if": {"filter_query": '{status} = "On Time"', "column_id": "icon"},
"color": "green",
},
],
)
]
)
if __name__ == "__main__":
app.run_server(debug=True)
```
-----------
**Adding images using the html <img> tag. This can make it easier to control image size and add other style.**

```
import dash
import dash_html_components as html
import dash_table
import pandas as pd
seattle = "<img src='https://upload.wikimedia.org/wikipedia/commons/2/23/Space_Needle_2011-07-04.jpg' height='75' />"
paris = "<img src='https://upload.wikimedia.org/wikipedia/commons/a/a8/Tour_Eiffel_Wikimedia_Commons.jpg' height='75' />"
nyc = "<img src='https://upload.wikimedia.org/wikipedia/commons/d/dd/Lady_Liberty_under_a_blue_sky_%28cropped%29.jpg' height='75' />"
app = dash.Dash(__name__)
df = pd.DataFrame(
dict(
[
("temperature", [13, 43, 50]),
("city", ["NYC", "Paris", "Seattle"]),
("image", [nyc, paris, seattle]),
]
)
)
app.layout = html.Div(
[
dash_table.DataTable(
css=[dict(selector="p", rule="margin: 0px;")],
data=df.to_dict("records"),
columns=[
{"id": "image", "name": "", "presentation": "markdown"},
{"id": "city", "name": "city"},
{"id": "temperature", "name": "temperature"},
],
markdown_options={"html": True},
style_table={"width": 200},
)
]
)
if __name__ == "__main__":
app.run_server(debug=True)
```

