I have a dash datatable showing a calendar. I would like to conditionally format the entire column of the datatable based on the value of one of the cells in that column. My end goal is for the weekend days to be shaded differently than the week days.
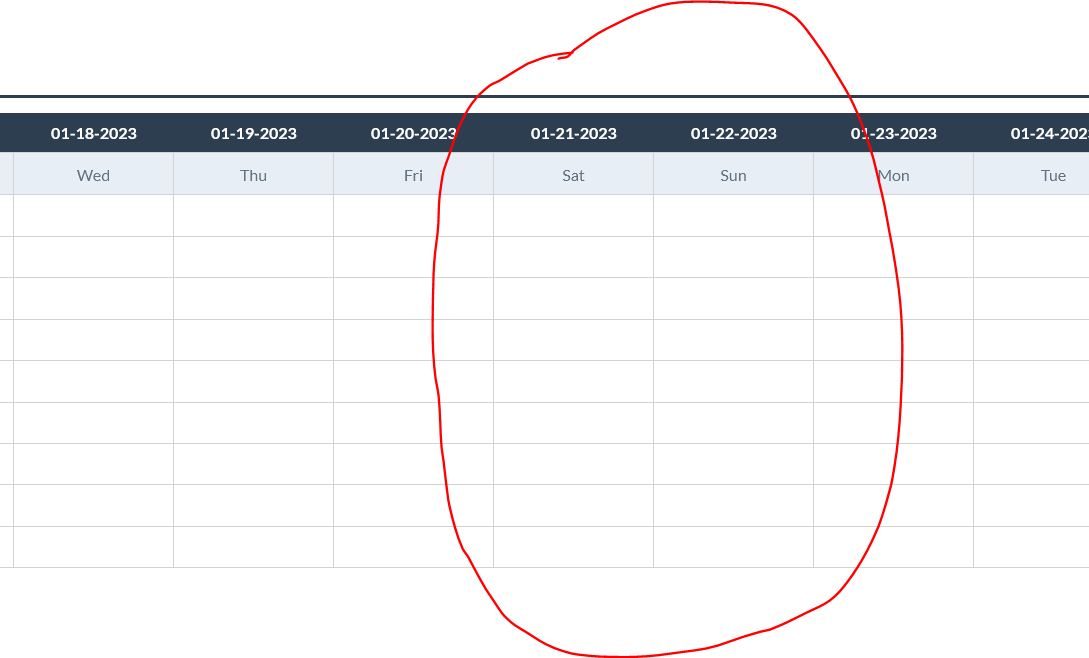
Here’s what my current table looks like:
I’m able to conditionally format the rows with style_data_conditional by programmatically creating the formatting like this:
style_data_conditional = [{'if': {'column_id': ['01-18-2023'], 'filter_query': '{01-18-2023} = "Mon" or {01-18-2023} = "Tue" or {01-18-2023} = "Wed" or {01-18-2023} = "Thu" or {01-18-2023} = "Fri" or {01-18-2023} = "Sat" or {01-18-2023} = "Sun"'}, 'backgroundColor': 'rgb(24,92,161,0.1)', 'color': 'rgb(44,62,80,0.7)'}
{'if': {'column_id': ['01-19-2023'], 'filter_query': '{01-19-2023} = "Mon" or {01-19-2023} = "Tue" or {01-19-2023} = "Wed" or {01-19-2023} = "Thu" or {01-19-2023} = "Fri" or {01-19-2023} = "Sat" or {01-19-2023} = "Sun"'}, 'backgroundColor': 'rgb(24,92,161,0.1)', 'color': 'rgb(44,62,80,0.7)'}
{'if': {'column_id': ['01-20-2023'], 'filter_query': '{01-20-2023} = "Mon" or {01-20-2023} = "Tue" or {01-20-2023} = "Wed" or {01-20-2023} = "Thu" or {01-20-2023} = "Fri" or {01-20-2023} = "Sat" or {01-20-2023} = "Sun"'}, 'backgroundColor': 'rgb(24,92,161,0.1)', 'color': 'rgb(44,62,80,0.7)'} ...]
But I can’t figure out a way to do the same with the entire column if the value in the day cell is ‘Sat’ or ‘Sun’. I think what I’m looking for is style_column_conditional but that doesn’t exist.
Thanks in advance