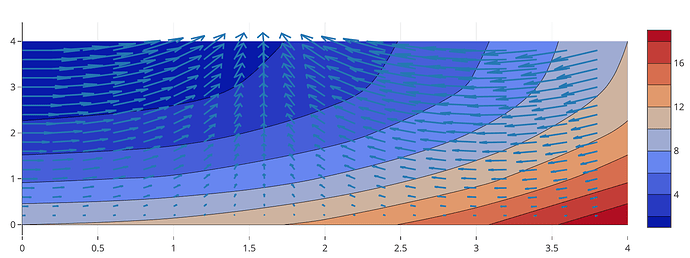
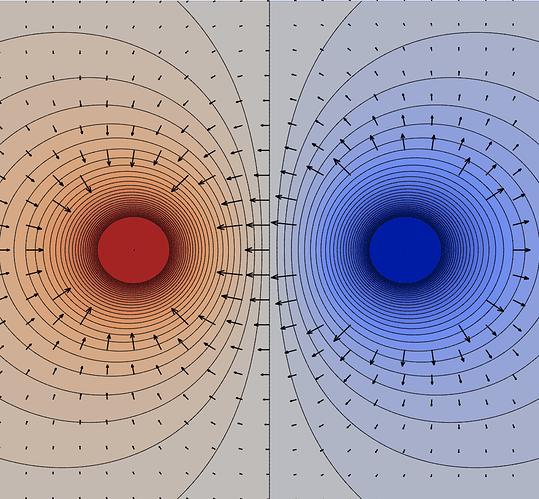
I tried and was not able to. Quiver map documentations shows how to overlay a scatter plot on it, but my attempt to follow a similar procedure with a contour map wasn’t successful. Just wondering if there’s anything that might be preventing this merging of these two styles of figures.
Hi @mathieuboudreau,
not sure but is the following related to what you aim to do? ->
import plotly.figure_factory as ff
import plotly.graph_objs as go
import numpy as np

x,y = np.meshgrid(np.arange(0, 4, .2), np.arange(0, 4, .2))
u = np.cos(x)*y
v = np.sin(x)*y

f = ff.create_quiver(x, y, u, v)
trace1 = f.data[0]
trace2 = go.Contour(
       z=[[10, 10.625, 12.5, 15.625, 20],
          [5.625, 6.25, 8.125, 11.25, 15.625],
          [2.5, 3.125, 5., 8.125, 12.5],
          [0.625, 1.25, 3.125, 6.25, 10.625],
          [0, 0.625, 2.5, 5.625, 10]]
   )
data=[trace1,trace2]
fig = go.FigureWidget(data)
fig
image:
2 Likes

