I am trying to use plotly in combinaison with ggplot. I have a barplot, that is normal using ggplot, but went plotly is used on the plot, all the negative values are turned to positive ones.
   dane<-data.frame(x=1:10,y=seq(-5,4),g=rep(c('A','B'),each=5))
   dane$x<-as.factor(dane$x)

  ggplot(data=dane[dane$g == "A",],aes(x=x,y=y,fill=g)) +
    geom_bar(stat='identity') +
    geom_bar(data=dane[dane$g == "B",],aes(x=x,y=y,fill=g),stat='identity') +
    scale_x_discrete(drop=FALSE)

  ggplotly()
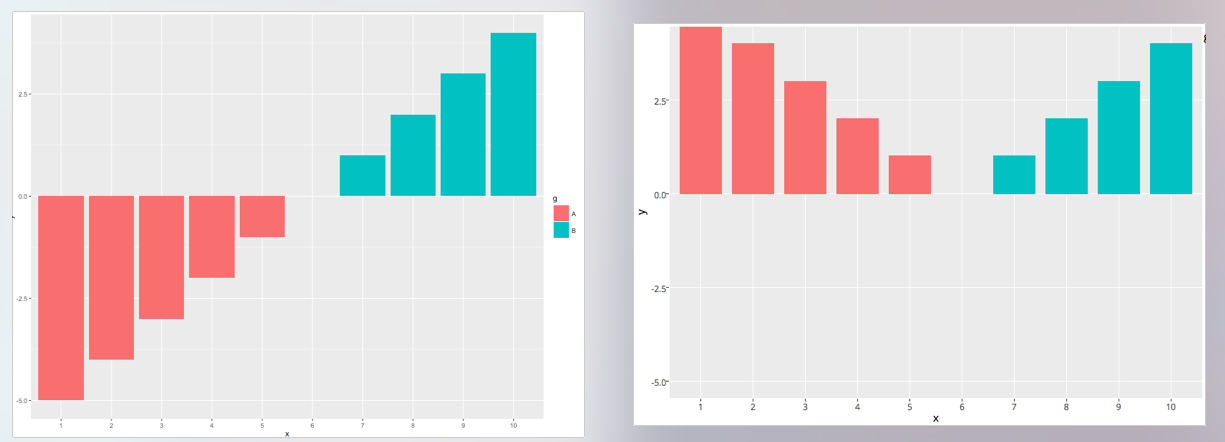
On the left is the plot with ggplot, on the right is the same plot, but after using plotly
Any idea what is going on here?