Introducing Depictio: open-source dashboarding system for life science researchers

Hey Plotly/Dash community! :waving_hand:

I’m Thomas, a Research Fellow hosted in the Data Science Centre of the European Molecular Biology Laboratory (EMBL) in Heidelberg. I have a PhD in bioinformatics.

I wanted to share an exciting project I’ve been working on for quite some time now and that might interest this community, entitled Depictio. It’s an open-source platform for creating interactive dashboards using Dash. The project has a focus on life-science (bioinformatics) scientific workflows, but the core functionality is applicable to any data science domain, so feel free to try it!

depictio-main-1754915546775_NI4RcJ7y-ezgif.com-optimize

(Full video on the docs)

The project is academic, open-source and any contribution is welcome! The general idea is to enables life-science researchers and data scientists to build interactive, shareable dashboards. The current version looks like an open-source alternative to Plotly Studio, but it’s gonna evolve towards bioinformatics specific features including life sciences related visualizations and better workflow integration (in coordination with https://nf-co.re/).

Technical architecture looks like :

  • Frontend Plotly Dash (primarily using Dash Mantine Components)
  • Backend: Async FastAPI with Python
  • Data Engine: Polars for high-performance processing
  • Storage: Delta Lake format (data) stored on MinIO S3 ; MongoDB for metadata coupled with the API
  • Deployment: Docker Compose & Kubernetes ready (helm chart available)

As part of the European Molecular Biology Laboratory (EMBL), Depictio is currently mainly used by life science researchers, including teams focusing on:

  • Single-cell genomics analysis & Multi-omics cancer research
  • Marine microbiome studies

:rocket: Live Demo: https://demo.depictio.embl.org

:books: Documentation: https://depictio.github.io/depictio-docs

:star: GitHub: GitHub - depictio/depictio: Bioinformatics web-platform visualisation dashboard creation

I wrote a small introductive blog article about the project if you’re interested : Depictio goes live ! - Depictio Documentation

I’m very open to feedback and ideas, especially regarding the technical aspects and how I could make the system more performant. If you know systems using similar technologies that are focusing on high performance datasets processing based on interactive updates (lazy operation, in-memory, caching, async, …), I’d very much like to look at them! Looking forward to your thoughts and feedback!

Thomas

6 Likes

Hello, it seems that there is a problem with the theming.

After switching themes, the plot should also change.

When directly opening the page (or reload) with dark theme:
One plot is still in light theme.

Also, when data filters are applied, the table will flash white and then reappear in dark mode:

PixPin_2025-08-12_22-56-45

PixPin_2025-08-12_22-58-00

1 Like

Hi @choc , thanks for the feedback, I’m aware of these limitations. Currently figure template/theme is changing only over page refresh after theme change. I was not able to find a way to trigger style/theme change of plotly figure without full re-rendering (regenerate the plotly figure completely). If I want to re-render it fully on the fly, I would need to reference the dcc.Store() related to the theme information I’m using, into an Input() instead of a State() in the central callback responsible for all the dashboard interactions, in order to trigger components update over theme change.

However, by doing this, it kinds of connect the rest of the interface (landing page, profile, projects section, auth section) to the “Dashboard” interface (what you shown in the photos/video), leading to non-referenced elements when consulting any other pages than the dashboard itself.

Regarding the Ag Grid style change, I’m using what is recommended by DMC : https://www.dash-mantine-components.com/dash-ag-grid , I notice they have same behavior on their website but result on my interface might be explained by the number of operations to be done.

Let me know if you have any ideas to improve those! :slight_smile:

Hi @weber8thomas, I used react-plotly.js (as I use React as frontend, FastAPI as backend). To make the plot aware of theme changes, I update the revision prop value. Internally, it uses Plotly.react to refresh the plot which is more efficient than Plotly.newPlot.

Sorry, I haven’t used Dash before, so I’m not sure how to solve this problem in Dash exactly.

Hi @weber8thomas

Just wanted to say welcome to the Dash community and thanks for sharing - this looks like a great project!

You mention you are looking to improve performance. The theme switch issues actually highlights one way you could speed things up. You are correct that the DMC docs recommends updating the className of the grid to change the theme. This is not a great solution, as there can be a lag as the grid updates, but it should only happen when the entire app theme changes. However, in your app when in dark mode and the data updates (like changing the slider) the grid first renders in light mode then changes it to dark. This indicates that you are updating the entire grid when the data changes. You will see much better performance if you use rowTransaction so just the data is updated.

Another thing that could help performance is to stick with a single theme for now and add a theme switch later.

To handle the error for the non-existent components, you can make them optional (as of dash 3.1)

I see you are using both DMC and DBC are you running into any conflicts with styling? Is there a reason to use both libraries?

2 Likes

Thanks @choc ! Will look into it and see if I can leverage similar property in Dash

Thanks @choc ! Will look into it and see if I can leverage similar property in Dash

Many thanks @AnnMarieW for your interest and advices. I will look into the transaction for AgGrid, sounds a smart idea.
Same for the optional callback properties, there are actually plenty of other options that could be helpful as well:

  • “Updating Component Properties when a Callback is Running” > example :
  • “Improving Performance with Memoization”
  • “Callbacks with No Outputs”
  • “Setting Properties Directly”
  • " Using Async/Await in Callbacks"
  • " Background Callback Caching"

I started to use both as I was more experienced with DBC row/col grid system and progressively switch from DBC to DMC. Would you advise get rid of it completely ?

What would be your recommendation @AnnMarieW in such a system to optimise load? I tried to setup background callback caching & async callbacks on prototype but not really successful so far.

@weber8thomas

Before adding a lot of new complexity, I’d recommend making what you have currently run faster. Your sample app is very simple - two filters, two figures, and a grid. The dataset is tiny. This app should be lightning fast without things like background callbacks or caching. I’d start with optimizing the callbacks so they only run when needed.

Here is a tool that can help find bottlenecks: Performance Profiling Dash apps with Werkzeug

It’s better to stick with either DBC or DMC. It reduces the dependencies and will be easier to maintain going forward. You will also have a more consistent design (colors, fonts, sizes of buttons and input fields etc). If you continue to use DMC as your primary component library, it also has a good grid layout system. I just added a new guide in the docs that gives an overview of layout components in DMC that you might find helpful.

2 Likes

Hi @weber8thomas ,

first of all very cool application! Regarding the theming, you an use dash Patch to only update the template instead f the whole figure. I use this register function to avoid creating a dict id for every graph.


    def register_plotly_cb(cls, figure_id: str) -> None:
        @callback(
            Output(figure_id, "figure", allow_duplicate=True),
            Input(cls.ids.store, "data"),
            prevent_initial_call=True,
        )
        def apply_theme(theme):
            template = (
                pio.templates["plotly"]
                if theme == "light"
                else pio.templates["plotly_dark"]
            )
            patch = Patch()
            patch.layout.template = template
            return patch

register_plotly_cb("your-graph-id")

And regarding your perfomance issues - you get an error everytime you interact with one of the filer components. Got 300 error messages. Another thing is that you have quit a lot timeouts in your clientside callbacks - clientside callbacks get executed in the main thread and block all other UI updates - so when you set a 300 ms timeout you get 300 ms no updates, I dont know if this could be solved with async clientside callbacks. Another thing is that the “interactive-component-value” range filter is a direct input to quite a lot callbacks. One change on the slider triggers 11 network request while the last 3 come in with. And most of the errors are coming from these interactions. After checking the network tab with some changes on the slider produced around 1000 error messages, but I think they are all the same, so definitely have a look at that :smiley:

I hope this helps,

Christian

3 Likes

Hi @AnnMarieW @Datenschubse,

Many thanks for your insights and super helpful feedback :folded_hands:. I worked on implementing some of your suggestions over the last 10 days. Here is a summary and some questions as well.

  • Profiling & performance : @AnnMarieW, thanks for mentioning that tutorial based on Werkzeug. I used it to track performance issues and managed to implement some basic grouping/caching mechanisms to reduce API calls + started implementing dataframe caching with Redis as well. I’ll come back below on the remaining challenges & bottlenecks I identified. Performance feels better overall now.
  • @AnnMarieW & @Datenschubse : Regarding theming, @AnnMarieW is right, mixing DBC & DMC forced me to implement some CSS changes that are problematic for performance. Right now, I disabled the theme change when you’re on the dashboard page, this needs to be done on any prior pages first. Still, the dash Patch you mentioned @Datenschubse was exactly what I was looking for to update figures theme, this is working fine and will be useful once I harmonised the grid system to DMC.
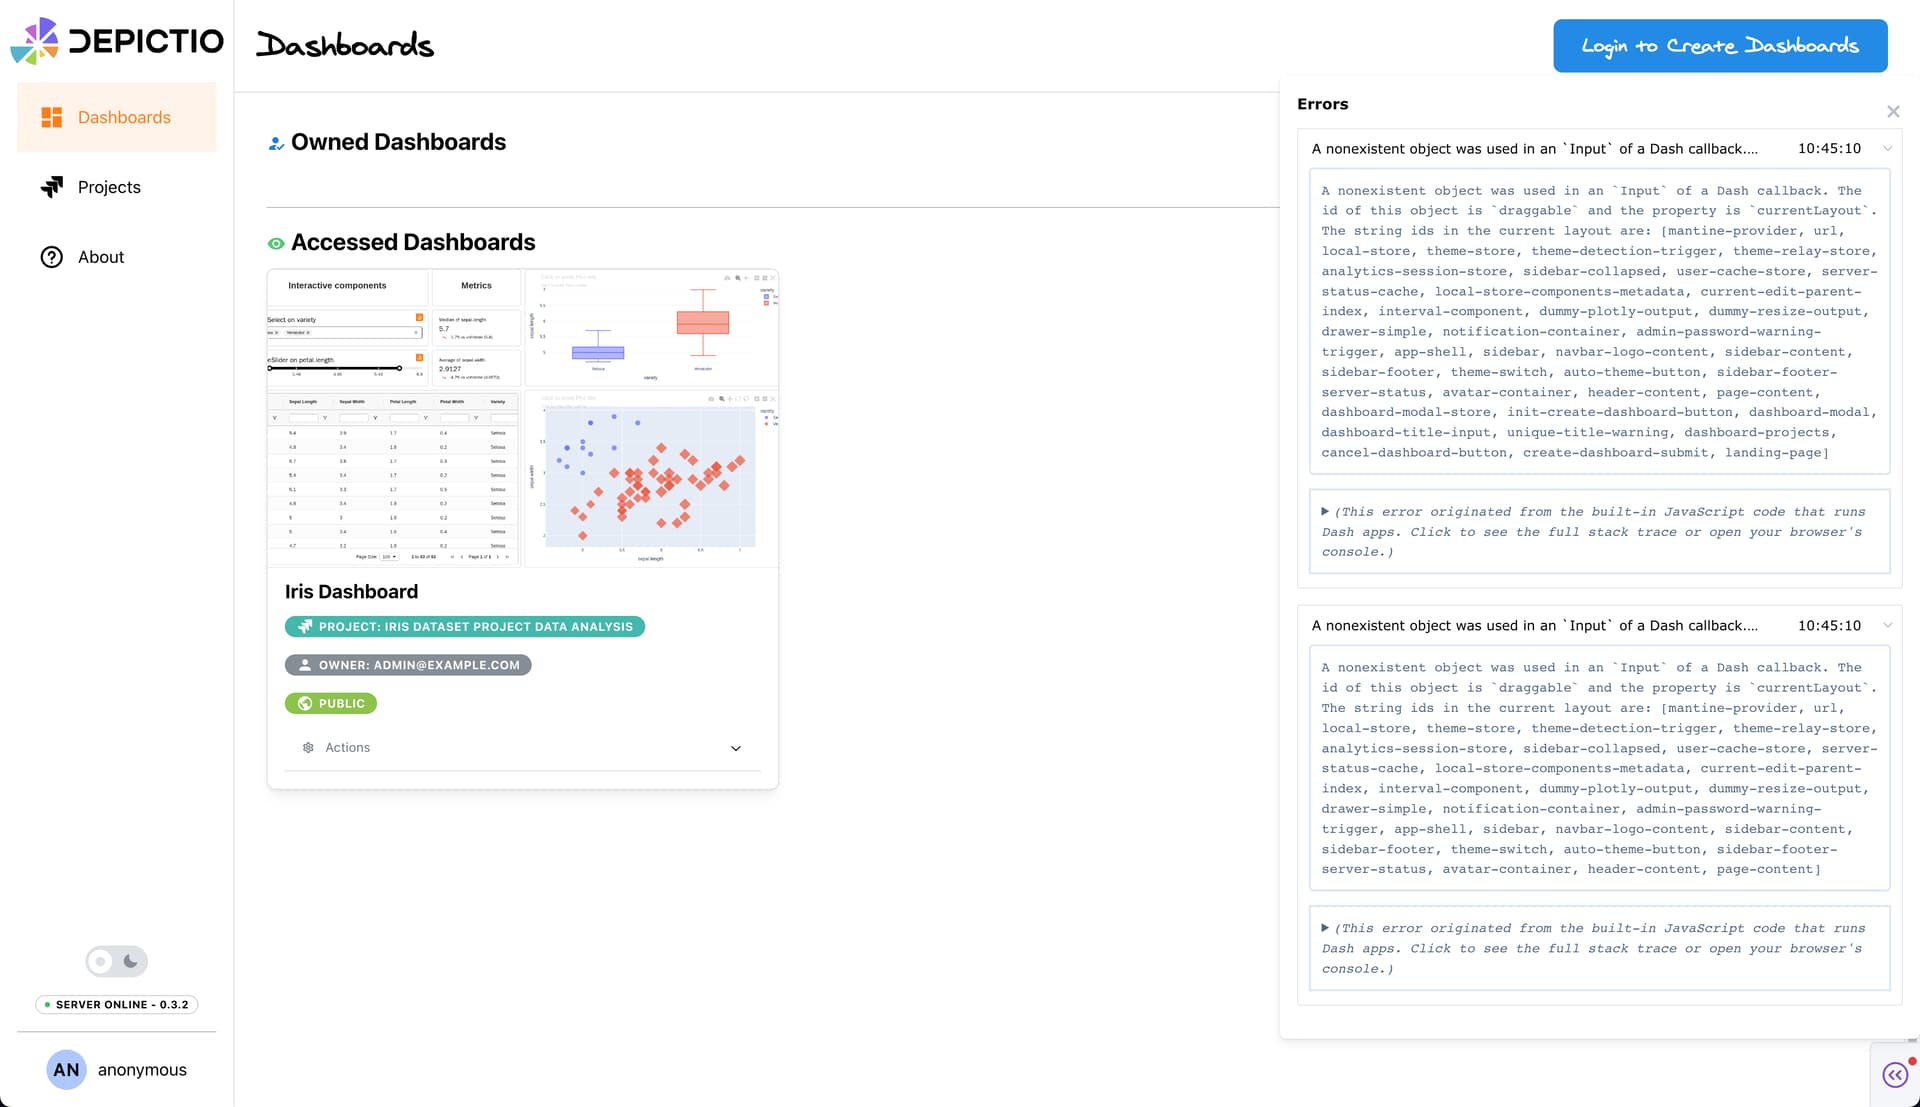
  • Console issues & timeout: @Datenschubse, thanks for mentioning this, should be solve now except a warning for dash-ace I could not figure out. Regarding clientside callbacks timeout, I can imagine you identified this using the browser console, how would you optimise those timeouts in order not to block the UI ?

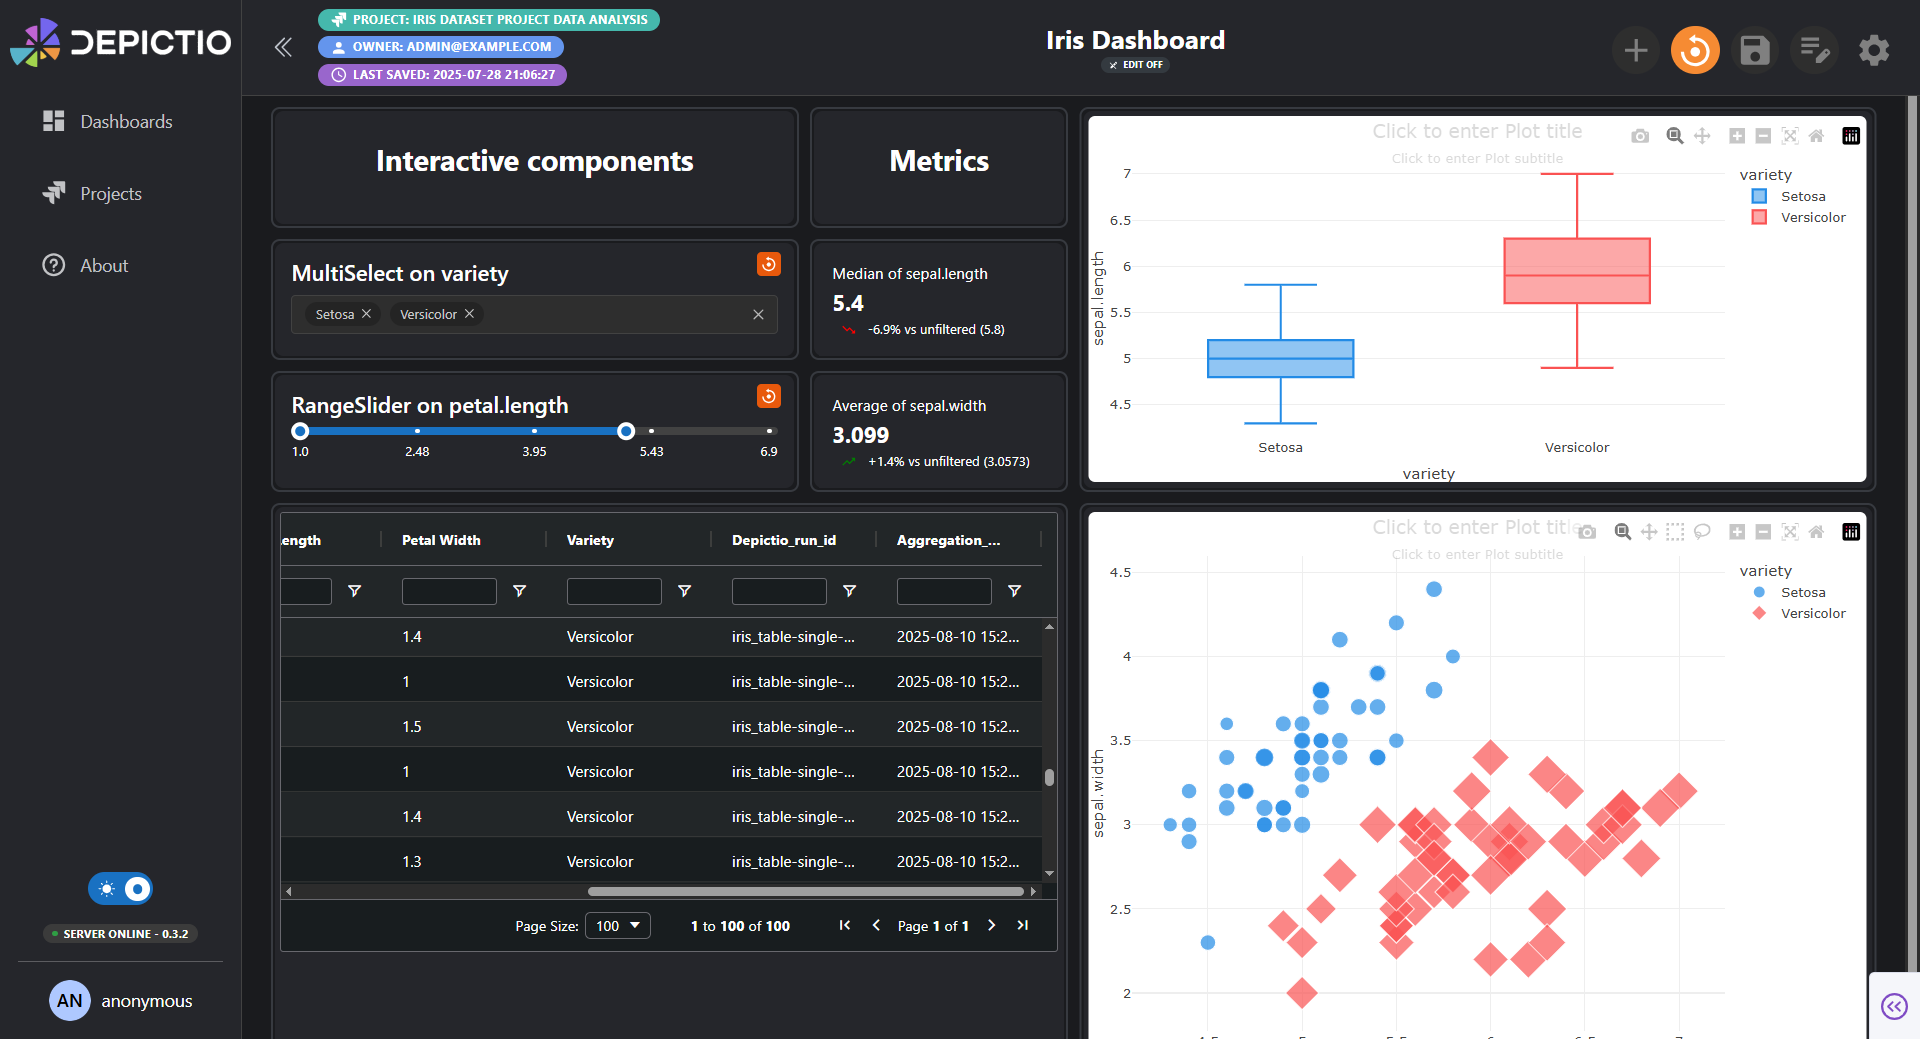
Profiling helped a lot in general but my understanding is that I should in the near future plan a design revision of my dash implementation. If I got it correctly, the way Dash works is that, the more complex are the callbacks and the number of the outputs, the larger is becoming the dash component tree, leading to performance issues.

I think this is visible in profiling analysis below for instance:

 SUMMARY:
   Total requests analyzed: 425
   Slow requests (>50ms): 6

🐌 SLOWEST REQUESTS:
   1. POST _dash-update-component
      Duration: 731ms
      File: POST._dash-update-component.731ms.1756200646.prof
   2. POST _dash-update-component
      Duration: 572ms
      File: POST._dash-update-component.572ms.1756200768.prof
   3. POST _dash-update-component
      Duration: 542ms
      File: POST._dash-update-component.542ms.1756200765.prof
   4. POST _dash-update-component
      Duration: 470ms
      File: POST._dash-update-component.470ms.1756199927.prof
   5. POST _dash-update-component
      Duration: 258ms
      File: POST._dash-update-component.258ms.1756200641.prof

📊 ENDPOINT PERFORMANCE:
   _dash-update-component:
      Avg: 48.1ms | Max: 731ms | Count: 76
   _dash-component-suites.dash_ag_grid.async-community.js:
      Avg: 7.3ms | Max: 12ms | Count: 3
   static.screenshots.68ac6a55993caec967db80c5.png:
      Avg: 7.0ms | Max: 12ms | Count: 2
   _dash-component-suites.dash.dcc.dash_core_components.v3_2_0m1754906532.js:
      Avg: 6.0ms | Max: 6ms | Count: 1
   static.screenshots.6824cb3b89d2b72169309737.png:
      Avg: 5.5ms | Max: 8ms | Count: 2

🔍 DETAILED FUNCTION ANALYSIS:
   Request #1: _dash-update-component (731ms)
   Total functions analyzed: 2471

   📊 TOP FUNCTIONS BY TIME:
       1. threading.py:1018(_bootstrap)
          Time: 0.7309s (99.95%) | Calls: 1 | Per-call: 730.88ms
       2. profiler.py:114(runapp)
          Time: 0.7308s (99.94%) | Calls: 1 | Per-call: 730.81ms
       3. app.py:2160(wsgi_app)
          Time: 0.7308s (99.94%) | Calls: 1 | Per-call: 730.78ms
       4. app.py:1471(full_dispatch_request)
          Time: 0.7307s (99.92%) | Calls: 1 | Per-call: 730.69ms
       5. app.py:1446(dispatch_request)
          Time: 0.7306s (99.91%) | Calls: 1 | Per-call: 730.60ms
       6. sync.py:164(__call__)
          Time: 0.7306s (99.91%) | Calls: 1 | Per-call: 730.57ms
       7. threading.py:323(wait)
          Time: 0.7304s (99.89%) | Calls: 3 | Per-call: 243.48ms
       8. current_thread_executor.py:63(run_until_future)
          Time: 0.7304s (99.89%) | Calls: 1 | Per-call: 730.41ms
       9. thread.py:54(run)
          Time: 0.7303s (99.88%) | Calls: 1 | Per-call: 730.34ms
      10. base_events.py:655(run_until_complete)
          Time: 0.7300s (99.83%) | Calls: 3 | Per-call: 243.34ms
      11. base_events.py:631(run_forever)
          Time: 0.7300s (99.83%) | Calls: 3 | Per-call: 243.33ms
      12. base_events.py:1922(_run_once)
          Time: 0.7300s (99.82%) | Calls: 6 | Per-call: 121.66ms
      13. runners.py:86(run)
          Time: 0.7299s (99.82%) | Calls: 1 | Per-call: 729.94ms
      14. events.py:86(_run)
          Time: 0.7299s (99.81%) | Calls: 6 | Per-call: 121.65ms
      15. ~:0(<method 'run' of '_contextvars.Context' objects>)
          Time: 0.7299s (99.81%) | Calls: 6 | Per-call: 121.65ms

   🧬 BYTEARRAY OPERATIONS:
       1. ~:0(<method 'endswith' of 'bytearray' objects>)
          Time: 0.0001s (0.01%) | Calls: 105
       2. ~:0(<method 'split' of 'bytearray' objects>)
          Time: 0.0000s (0.01%) | Calls: 15
       3. ~:0(<method 'extend' of 'bytearray' objects>)
          Time: 0.0000s (0.00%) | Calls: 1

   📦 SERIALIZATION OPERATIONS:
       1. basedatatypes.py:5652(to_plotly_json)
          Time: 0.0210s (2.88%) | Calls: 16
       2. _utils.py:24(to_json)
          Time: 0.0181s (2.47%) | Calls: 1
       3. _json.py:79(to_json_plotly)
          Time: 0.0180s (2.47%) | Calls: 1
       4. __init__.py:183(dumps)
          Time: 0.0180s (2.46%) | Calls: 27
       5. utils.py:154(encode)
          Time: 0.0179s (2.44%) | Calls: 1
       6. encoder.py:183(encode)
          Time: 0.0178s (2.43%) | Calls: 27
       7. encoder.py:205(iterencode)
          Time: 0.0177s (2.43%) | Calls: 3
       8. utils.py:240(encode_as_plotly)
          Time: 0.0159s (2.17%) | Calls: 315
       9. basedatatypes.py:3326(to_plotly_json)
          Time: 0.0096s (1.31%) | Calls: 2
      10. base_component.py:239(to_plotly_json)
          Time: 0.0063s (0.87%) | Calls: 320

   ⚡ DASH/PLOTLY OPERATIONS:
       1. dash.py:1467(async_dispatch)
          Time: 0.7181s (98.20%) | Calls: 1
       2. _callback.py:640(add_context)
          Time: 0.6935s (94.84%) | Calls: 1
       3. _callback.py:58(_invoke_callback)
          Time: 0.5477s (74.90%) | Calls: 1
       4. callbacks.py:18(display_page)
          Time: 0.4763s (65.14%) | Calls: 1
       5. app_layout.py:452(create_dashboard_layout)
          Time: 0.2486s (33.99%) | Calls: 1
       6. restore_dashboard.py:265(load_depictio_data_sync)
          Time: 0.1915s (26.19%) | Calls: 1
       7. restore_dashboard.py:50(render_dashboard)
          Time: 0.1854s (25.35%) | Calls: 1
       8. basedatatypes.py:5652(to_plotly_json)
          Time: 0.0210s (2.88%) | Calls: 16
       9. basedatatypes.py:2877(plotly_update)
          Time: 0.0210s (2.87%) | Calls: 24
      10. _json.py:79(to_json_plotly)
          Time: 0.0180s (2.47%) | Calls: 1

   🔢 NUMPY/NDARRAY OPERATIONS:
       1. basevalidators.py:53(copy_to_readonly_numpy_array)
          Time: 0.0039s (0.54%) | Calls: 60
       2. series.py:1376(to_numpy)
          Time: 0.0010s (0.13%) | Calls: 25
       3. basevalidators.py:168(is_numpy_convertable)
          Time: 0.0010s (0.13%) | Calls: 1,541
       4. series.py:285(to_numpy)
          Time: 0.0010s (0.13%) | Calls: 25
       5. ~:0(<method '__deepcopy__' of 'numpy.ndarray' objects>)
          Time: 0.0006s (0.08%) | Calls: 40
       6. ~:0(<method 'reduce' of 'numpy.ufunc' objects>)
          Time: 0.0004s (0.05%) | Calls: 48
       7. series.py:4252(to_numpy)
          Time: 0.0003s (0.04%) | Calls: 25
       8. ~:0(<method 'to_numpy' of 'builtins.PySeries' objects>)
          Time: 0.0003s (0.04%) | Calls: 25
       9. ~:0(<method 'copy' of 'numpy.ndarray' objects>)
          Time: 0.0002s (0.03%) | Calls: 98
      10. ~:0(<method '__array__' of 'numpy.ndarray' objects>)
          Time: 0.0002s (0.03%) | Calls: 5

💡 RECOMMENDATIONS:
   🎯 Focus on these slow endpoints:
      - _dash-update-component: avg 48.1ms, max 731ms
   🔧 6 slow Dash callbacks found - consider caching or optimization

I started switching to async & background callbacks but it was even worse so stopped quickly.

Currently my system is designed in a way where a central callback (depictio/depictio/dash/layouts/draggable.py at main · depictio/depictio · GitHub) is updating the dashboard for different types of actions (new component, component edited, component duplicated, interactive action, draggable layout change, …). Each callback update is triggering helper functions (depictio/depictio/dash/component_metadata.py at 71fc3708d24b7ca4a97004dd0d1f592ed7101de8 · depictio/depictio · GitHub), leading to components rebuild in a sequential way. The massive aspect for that callback was initially retained to avoid having duplicate outputs and conflicted callbacks.

If I want to switch to async + background component building, I’m thinking what would be the optimal implementation for this. Would something like below help in optimising the Dash callbacks structure, reducing complexity of the tree and improving performance in general? My idea was to switch from a single callback where build functions are called sequentially to small component-level rendering callbacks using async & background.

@app.callback(
      Output("component-render-trigger", "data"),  
      [Input({"type": "btn-done", "index": ALL}, "n_clicks"),
       Input({"type": "btn-done-edit", "index": ALL}, "n_clicks"),
       Input({"type": "interactive-component-value", "index": ALL}, "value")],
      prevent_initial_call=True
  )
  def handle_component_interactions(btn_clicks, btn_edit_clicks, values):
      """Light callback - just trigger component updates with action type"""
      ctx = dash.callback_context

      # Determine action type
      if "btn-done-edit" in ctx.triggered[0]["prop_id"]:
          action_type = "edit"
      elif "btn-done" in ctx.triggered[0]["prop_id"]:
          action_type = "new"
      elif "interactive-component-value" in ctx.triggered[0]["prop_id"]:
          action_type = "update"
      else:
          action_type = "unknown"

      return {
          "trigger_id": ctx.triggered_id,
          "timestamp": time.time(),
          "action": action_type,
          "needs_update": True
      }

  @app.callback(
      Output({"type": "draggable-item", "index": MATCH}, "children"),
      Input("component-render-trigger", "data"),
      State({"type": "component-meta", "index": MATCH}, "data"),
      State("local-store", "data"),
      background=True,
      progress=[Output({"type": "component-progress", "index": MATCH}, "children")]
  )
  async def render_draggable_component_direct(set_progress, trigger, component_meta, local_data):
      if not trigger or not trigger.get("needs_update"):
          return dash.no_update

      try:
          # Set initial progress
          set_progress(dmc.Loader(size="sm", variant="dots"))

          component_data = await fetch_component_data_async(
              component_meta.get("data_collection_id")
          )

          if component_data:
              processed_data = await process_component_data_async(
                  component_data,
                  component_meta
              )
          else:
              processed_data = None

          component = await build_component_async(
              component_meta,
              processed_data,
              local_data
          )

          set_progress(None)

          return component

      except Exception as e:
          logger.error(f"Component rendering failed: {e}")
          set_progress(None)
          return dmc.Alert(
              "Component failed to load",
              title="Error",
              color="red",
              icon=DashIconify(icon="mdi:alert")
          )

Let me know what’s your feedback and view on this and thanks again for all your help! :slight_smile:

Thomas

Hi @weber8thomas

The revised site looks a lot better - nice progress!

It’s still a little laggy, given the small data set, so there should still be potential to make callbacks more efficient. It should not be necessary to add background callbacks when working with small data – that only adds complexity.

The structure of your project is very complex, so it’s hard to give specific advice without spending a huge amount of time. However, in general, it’s better to have different callbacks for different features (rather than every interaction going through one). For example, when you move the slider, it should not trigger any of the draggable features, it should only update the data. Similarly, if an element is dragged, it should not update data or rebuild the element(s). The callback you propose is better, so that might help.

I also don’t understand why the debug menu shows in your live app - that’s typically disabled when an app is deployed. There are a lot of error messages still in the console, and there may be things that are having an impact on performance.

Hi @AnnMarieW,

Many thanks for the feedback!

It’s still a little laggy, given the small data set, so there should still be potential to make callbacks more efficient. It should not be necessary to add background callbacks when working with small data – that only adds complexity.

When you say laggy, you mean with the example dashboard?
Indeed the idea is to deal with larger datasets and to keep performance, so I’d like to revise the design to be compatible with such scenarios.

The structure of your project is very complex, so it’s hard to give specific advice without spending a huge amount of time. However, in general, it’s better to have different callbacks for different features (rather than every interaction going through one). For example, when you move the slider, it should not trigger any of the draggable features, it should only update the data. Similarly, if an element is dragged, it should not update data or rebuild the element(s). The callback you propose is better, so that might help.

I completely understand the project looks complex and difficult to apprehend code wise in order to give technical feedback. Your points on modularity are completely accurate and in line with what I had in mind in a future revamp.

I also don’t understand why the debug menu shows in your live app - that’s typically disabled when an app is deployed. There are a lot of error messages still in the console, and there may be things that are having an impact on performance.

Regarding the debug menu, this is intentional, I’m using debug=False but just kept dev_tools_ui=True in order to get feedback from the user if they face issues, as there are many different options and combination over figure creation especially and resulting scenarios.
Concerning the console error messages, I’m surprised as I don’t have any error messages on my browser console.