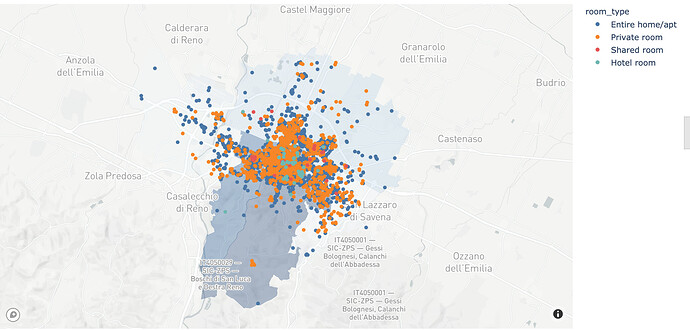
Hi!
I have a scatterplot with a lot of point and I would like that the Choroplet representing the density of point in each district was initially hidden and that it could be added by user on top of the points in a second moment. Is there a way to do this? In case this is not possible, how do I add the scatter on top of choro so that I can hover the points and not the districts?
Furthermore, is there a way to instruct the choroplet to consider the median values rather than the average ones (not for this choro in particular, for another one related to prices)?
fig2 = px.scatter_mapbox(geo_df,
                    lat=geo_df.geometry.y,
                    lon=geo_df.geometry.x,
                    hover_name="name",
                    color="room_type",
                    hover_data={'room_type':False,
                                'latitude':False,
                                'longitude': False,
                                'name':False},
                    color_discrete_sequence= px.colors.qualitative.T10)

fig2.add_trace(go.Choroplethmapbox(name="Density Choroplet", geojson=neighbourhoods_geo,
                    featureidkey='properties.neighbourhood',
                    locations=list_x_neigh.neighbourhood,
                    z=list_x_neigh.Listings, zmin=100, zmax=1384,
                    marker_opacity=.3,  marker_line_width=0,
                    colorscale='Blues', showscale=False))


fig2.update_geos(fitbounds="locations", visible=False)

fig2.update_layout(title="AirBnb accomodation type",mapbox_style="light", mapbox_accesstoken=token,
                  mapbox_zoom=10.5, mapbox_center = {"lat": bologna_point.y, "lon": bologna_point.x})
fig2.update_layout(margin={"r":0,"t":40,"l":0,"b":0})
