Hi!
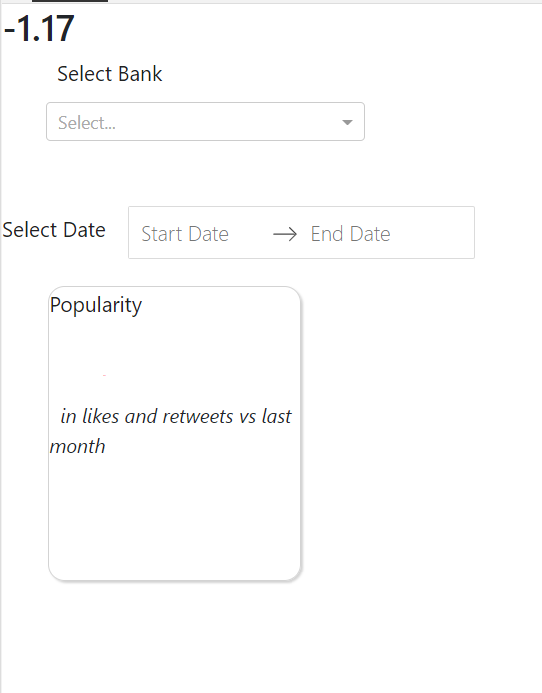
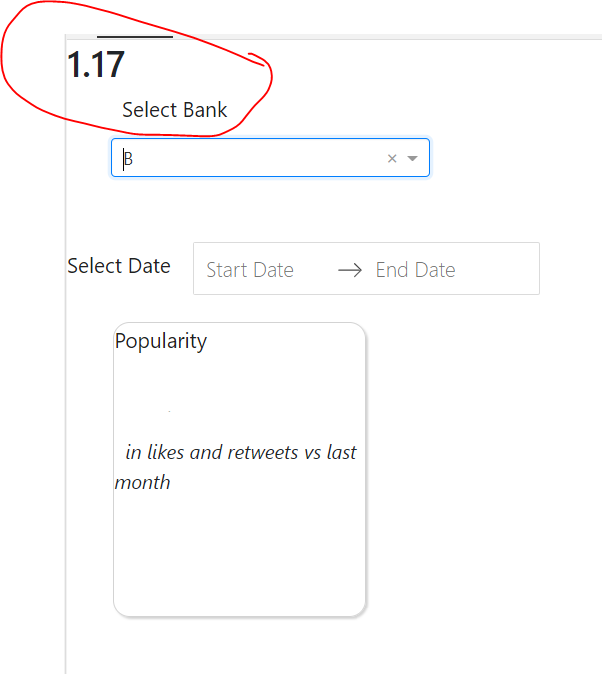
I am using an indicator chart and a callback in my webapp. I would like the chart figure to change when the user selects from a drop down adn a date picker. The code I use (below) makes the indicator figure disappear once a dropdown value is selected (or even once the page is refreshed without selection).
Does anyone know what am I doing wrong here? I’m quite new to dash and to python in general.
pop_chgrate = cbank_df[cbank_df["created_at_yearmonth"]==
                       cbank_df["created_at_yearmonth"].sort_values(ascending = False).unique()[1]]["popularity_changerate"].agg("median")
pop_chgrate = round(pop_chgrate,2)

fig = go.Figure(
              go.Indicator(
                mode="delta",
                value=pop_chgrate,
                delta={"reference": 1, "relative": True},
                           )
              )
fig.update_layout(
                margin=dict(l=0, r=0, t=0, b=0)
                )

app.config.external_stylesheets = [dbc.themes.BOOTSTRAP]

app.layout =  html.Div(children=
                       [html.Span('Popularity', style={'font-size':'19px','color':'#212121',
                                                       'display':'flex','justify-content':'center',
                                                       'padding':'15px 0px 0px 0px'}),

                        html.Br(),
                        html.Br(),
                        dcc.Graph(id='pop_chgrate',figure=fig, style={"height": 50, "width": 100, 'display':'inline-block'}),
                        html.Span('in likes and retweets vs last month',style={'font-size':'18px',
                                                                                 'padding':'35px 10px 0px 10px',
                                                                                 'font-style':'italic'})
                       ],
                       style={'width':'230px','height':'268px','border':'1px solid lightgrey', 'borderRadius':'15px',
                              'borderWidth':'1px','box-shadow': '2px 2px 2px lightgrey','display':'inline-block',
                              'margin':'10px 0px 0px 42px'}
                      )
@app.callback(
                Output(component_id = 'pop_chgrate',component_property='figure'),
                Input(component_id ='date_picker', component_property='start_date'),
                Input(component_id ='date_picker', component_property='end_date'),
                Input(component_id ='bank_dropdown' , component_property='value')
             )
def update_most_pop_lang_pie(start_date,end_date,bank_name):
    pop_chgrate_copy = cbank_df.copy(deep=True)

    if start_date is not None:
        st_date_string = start_date
        bank_st_date_string = start_date
    else:
        st_date_string = tweets_df['created_at'].apply(str).str.slice(0,10).min()
        bank_st_date_string = tweets_df[tweets_df['author_name']==bank_name]['created_at'].apply(str).str.slice(0,10).min()

    if end_date is not None:
        e_date_string = end_date
        bank_e_date_string = end_date
    else:
        e_date_string = tweets_df['created_at'].apply(str).str.slice(0,10).max()
        bank_e_date_string = tweets_df[tweets_df['author_name']==bank_name]['created_at'].apply(str).str.slice(0,10).max()


    if bank_name:
        pop_chgrate_copy = cbank_df.copy(deep=True)
        pop_chgrate = pop_chgrate_copy[(pop_chgrate_copy['author_name']==bank_name) &
                                              (pop_chgrate_copy['created_at_yearmonth']>= bank_st_date_string[0:7]) &
                                              (pop_chgrate_copy['created_at_yearmonth']<= bank_e_date_string[0:7])]["popularity_changerate"].agg("median")
        pop_chgrate = round(pop_chgrate,2)


    else:
        pop_chgrate_copy = cbank_df.copy(deep=True)
        pop_chgrate = pop_chgrate_copy[pop_chgrate_copy['created_at_yearmonth']==
                                             pop_chgrate_copy['created_at_yearmonth'].sort_values(ascending = False).unique()[1]]["popularity_changerate"].agg("median")
        pop_chgrate = round(pop_chgrate,2)


    fig = go.Figure(
              go.Indicator(
                mode="delta",
                value=pop_chgrate,
                delta={"reference": 1, "relative": True},
                           )
              )

    return fig
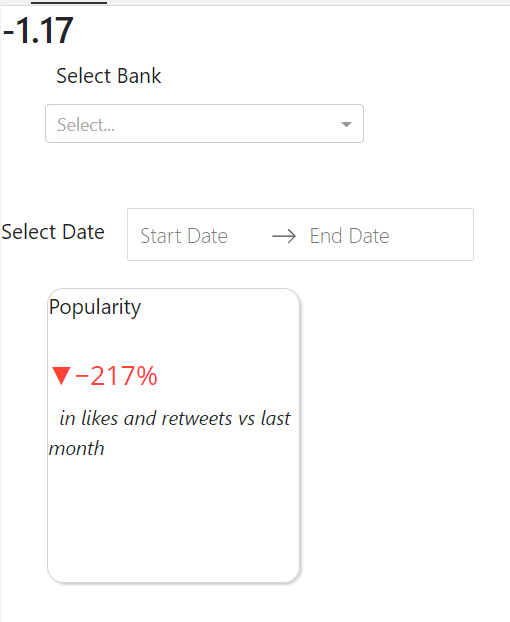
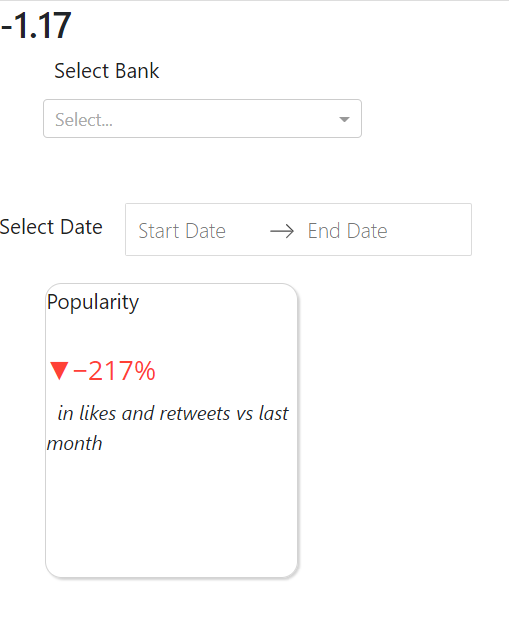
and this is how the output looks like