Hi thank you for your reply.
I have realised I didn’t show bit that were probably important.
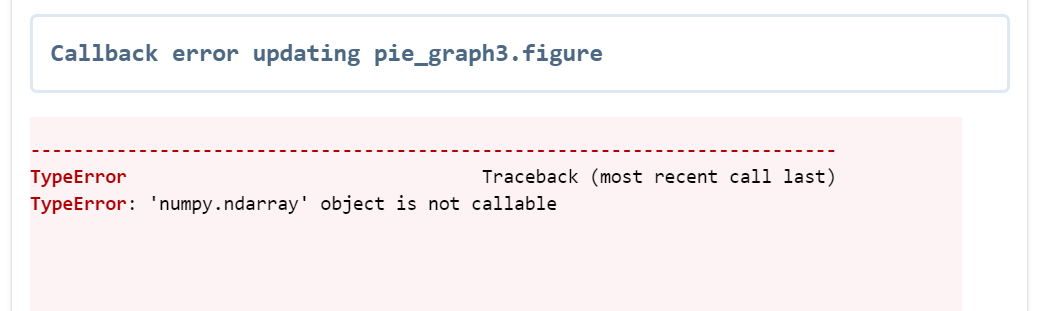
This image is my table. I am wanting to create a indicator graph for the ‘weeklygrosspaymean’ column which links to a dropdown for each area ‘lau115nm’. When I tried to use in the graph the ‘weeklygrosspaymean’ in the form of
> fullmeanwage = df['weeklygrosspaymean']
I would get this error:
This is the full code of the dash board:
import dash
from dash import html
import dash_bootstrap_components as dbc
from dash import dcc
from dash.dependencies import Output, Input
import pandas as pd
from jupyter_dash import JupyterDash
import plotly.graph_objects as go
import plotly.express as px
import json
from urllib.request import urlopen
import numpy as np
from geojson_rewind import rewind
with urlopen('https://raw.githubusercontent.com/plummy95/1312306/main/Local_Administrative_Units_Level_1_(December_2015)_Boundaries%20(1).json') as response:
counties = json.load(response)
counties_corrected=rewind(counties,rfc7946=False)
import io
quali=pd.read_csv('https://raw.githubusercontent.com/plummy95/1312306/main/qualificationpercentage.csv')
df=pd.read_csv('https://raw.githubusercontent.com/plummy95/1312306/main/totaldata.csv')
full=pd.read_csv('https://raw.githubusercontent.com/plummy95/1312306/main/totaldata.csv')
eastmidlands = pd.read_csv('https://raw.githubusercontent.com/plummy95/1312306/main/East%20Midlands.csv')
eastengland = pd.read_csv('https://raw.githubusercontent.com/plummy95/1312306/main/East%20of%20England.csv')
northeast = pd.read_csv('https://raw.githubusercontent.com/plummy95/1312306/main/North%20East.csv')
northwest = pd.read_csv('https://raw.githubusercontent.com/plummy95/1312306/main/North%20West.csv')
southeast = pd.read_csv('https://raw.githubusercontent.com/plummy95/1312306/main/South%20East.csv')
southwest = pd.read_csv('https://raw.githubusercontent.com/plummy95/1312306/main/South%20West.csv')
westmidlands = pd.read_csv('https://raw.githubusercontent.com/plummy95/1312306/main/West%20midlands.csv')
london = pd.read_csv('https://raw.githubusercontent.com/plummy95/1312306/main/london.csv')
yorkshirehumber = pd.read_csv('https://raw.githubusercontent.com/plummy95/1312306/main/yorkshire%20and%20the%20humber.csv')
meanwage = df['weeklygrosspaymean'].tail(1).iloc[0].astype(float)
meanwageEM = eastmidlands['weeklygrosspaymean']
fullmeanwage = df['weeklygrosspaymean']
dft = df.rename({"lau115nm" : "Local Authority", "predictedprevalence" : "Predicted Autism Prevalence", "percentageprevalence" : "Predicted Autism Percentage",
"Noqualifications" : "No Qualifications",
"Percentagenoqualification" : "No Qualification percentage", "Level1qualifications" : "Level 1 Qualifications", "percentagelevel1" : " Level 1 Qualification Percentage",
"Level2qualifications" : "Level 2 Qualifications", "percentagelevel2" : "Level 2 Qualification Percentage",
"percentageapprenticeship" : "Apprenticeship Qualification Percentage", "Level3qualifications" : "Level 3 Qualifications",
"percentagelevel3" : "Level 3 Qualification Percentage", "Level4qualificationsandabove" : "Level 4 Qualifications",
"percentagelevel4andabove" : "Level 4 Qualification Percentage", "Otherqualifications" : "Other Qualifications",
"percentageotherqualifications" : "Other Qualification Percentage", "weeklygrosspaymean" : "Mean Weekly Gross Pay"}, axis=1)
qualifications= df[['Noqualifications','Level1qualifications','Level2qualifications','Level3qualifications', 'Level4qualificationsandabove', 'Apprenticeship', 'Otherqualifications']].copy
yearqual = 2020
years = df['lau115nm'].unique()
years2 = df['year'].unique()
yearsplit = df.groupby('year')
[yearsplit.get_group(x) for x in yearsplit.groups]
pie_melt_select = quali
pie_melt_select = pd.melt(pie_melt_select, id_vars=["lau115nm", "region"], value_vars=['" % no qualification"', '"% level 1 qualification"', '" % level 2 qualification"', '" % apprenticeship"',
'" % level 3 qualification"', '" % level 4 and above"', '" % other qualifications"'], var_name="namepie", value_name="valuepie")
print(pie_melt_select)
pie_melt_prevalence = full
pie_melt_prevalence = pd.melt(pie_melt_prevalence, id_vars=["lau115nm", "region", "year"], value_vars=["predictedprevalence", "population"], var_name="namepie2", value_name="valuepie2")
all_options = {
'area' : df['lau115nm'],
'yearly' : df['year']
}
mergeregion = df["region"].unique()
tab_options = []
for location in df['lau115nm'].unique():
tab_options.append({'label':str(location), 'value':location})
app =JupyterDash(__name__, external_stylesheets=[dbc.themes.SKETCHY])
app.layout = html.Div([
html.H1("Autism Prevalence and Socioeconomic Status"),
dcc.Tabs(id="tabs", value='Tab1',children=[
dcc.Tab(label='Tab One', children=[
dbc.Row(
[
dbc.Col(html.Div("Predicted Autism Prevalence has been obtained through the Projecting Adult Needs and Service Information (POPPI v14.2 Jan 2022.)"
" Choropeth Map of Predicted Autism Prevalence Across England from 2020 to 2040: "),
width=4
),
]
),
dbc.Row(
[
dbc.Col(dcc.Graph(figure=fig2020prev),
width=100, lg={'size' : 12, "offset" : 3, 'order' :'first'}
),
]
),
dbc.Row(
[
dbc.Col(dcc.Dropdown(
id='graph-type',
placeholder = 'Select Region',
options = [
{'label' : 'England', 'value' : 'England'},
{'label' : 'East Midlands', 'value' : 'EastMidlands'},
{'label' : 'West Midlands', 'value' : 'WestMidlands'},
{'label' : 'East of England' , 'value' : 'EastEngland'},
{'label' : 'North East England' , 'value' : 'NorthEast'},
{'label' : 'North West England' , 'value' : 'NorthWest'},
{'label' : 'South East England' , 'value' : 'SouthEast'},
{'label' : 'South West England' , 'value' : 'SouthWest'},
{'label' : 'London' , 'value' : 'London'},
{'label' : 'Yorkshire and the Humber' , 'value' : 'YorkshireHumber'},
]
),
),
]
),
dbc.Row(
[
dbc.Col(dcc.Graph(
id='prevalencegraph'
),width=100, lg={'size' : 12, "offset" : 0,}
)
]
)
]),
dcc.Tab(label='Tab Two', children=[
html.Div(id='socioeconomic'),
dbc.Row(
[
dbc.Col(dcc.Dropdown(
id='qual-graph',
placeholder='Select Region',
options = [
{'label' : 'England', 'value' : 'England'},
{'label' : 'East Midlands', 'value' : 'EastMidlands'},
{'label' : 'West Midlands', 'value' : 'WestMidlands'},
{'label' : 'East of England', 'value' : 'EastEngland'},
{'label' : 'North West England', 'value' : 'NorthWest'},
{'label' : 'North East England', 'value' : 'NorthEast'},
{'label' : 'South East England', 'value' : 'SouthEast'},
{'label' : 'South West England', 'value' : 'SouthWest'},
{'label' : 'London', 'value' : 'London'},
{'label' : 'Yorkshire and the Humber', 'value': 'YorkshireHumber'},
]
),
),
]
),
dbc.Row(
[
dbc.Col(dcc.Graph(
id='qualifications'
), width=50, lg={'size' : 12, "offset" : 0,}
)
]
),
dbc.Row(
[
dbc.Col(dcc.Dropdown(
id='compareprev_dropdown',
placeholder='Select Region',
options = [
{'label' : 'England prevalence', 'value' : 'predictedprevalence'},
{'label' : 'East Midlands', 'value' : 'EastMidlands'},
{'label' : 'West Midlands', 'value' : 'WestMidlands'},
{'label' : 'East of England', 'value' : 'EastEngland'},
{'label' : 'North West England', 'value' : 'NorthWest'},
{'label' : 'North East England', 'value' : 'NorthEast'},
{'label' : 'South East England', 'value' : 'SouthEast'},
{'label' : 'South West England', 'value' : 'SouthWest'},
{'label' : 'London', 'value' : 'London'},
{'label' : 'Yorkshire and the Humber', 'value': 'YorkshireHumber'},
]
),
),
]
),
dbc.Row(
[
dbc.Col(dcc.Graph(
id='compareprev_graph'
), width=50, lg={'size' : 12, "offset" : 0,}
)
]
),
dbc.Row(
[
dbc.Col(dcc.Dropdown(
id='pie_dropdown_percentage',
options=[{'label' : y, 'value' : y} for y in years],
value=years[0],
multi=False,
clearable=False,
style={"width" : "50%"}
)
)
]
),
dbc.Row(
[
dbc.Col(dcc.Dropdown(
id='pie_dropdown_year',
options=[{'label': y, 'value' : y} for y in years2],
value=years2[0],
multi=False,
clearable=False,
style={"width" : "50%"}
)
)
]
),
dbc.Row(
[
dbc.Col(dcc.Graph(id='pie_graph'),
)
]
),
dbc.Row(
[
dbc.Col(dcc.Graph(id='pie_graph2'),
)
]
),
dbc.Row(
[
dbc.Col(children=[
dcc.Graph(id='pie_graph3'),
]
)
]
),
html.Div([
html.Label("State:", style={'fontSize':30, 'textAlign':'center'}),
dcc.Dropdown(
id='states-dpdn',
options=[{'label': s, 'value': s} for s in sorted(df.lau115nm.unique())],
value='Adur',
clearable=False
),
html.Label("Counties:", style={'fontSize':30, 'textAlign':'center'}),
dcc.Dropdown(id='counties-dpdn', options=[], multi=True),
dcc.Graph(id='display-map', figure={}),
dcc.Graph(id='quali-map', figure={})
])
]
),
])
])
@app.callback(
Output(component_id='pie_graph', component_property='figure'),
[Input(component_id='pie_dropdown_percentage', component_property='value')]
)
def update_graph(year):
piechart_qual = px.pie(pie_melt_select[pie_melt_select['lau115nm'] == str(year)],
title=f"Qualification type per percentage of the population",
values="valuepie",
color="namepie",
names="namepie"
)
return piechart_qual
@app.callback(
    Output(component_id='pie_graph2', component_property='figure'),
    [Input(component_id='pie_dropdown_percentage', component_property='value')]
)
def update_graph(year):
    piechart_qual2 =  px.bar(pie_melt_prevalence[pie_melt_prevalence['lau115nm'] == str(year)], x="namepie2", y="valuepie2",
                           title = "population level by percentage", animation_frame='year', hover_name="valuepie2", width=800,height=800,

                  )
    return piechart_qual2
# below this the code I am struggling with
@app.callback(
Output(component_id='pie_graph3', component_property='figure'),
[Input(component_id='pie_dropdown_percentage', component_property='value')]
)
def update_graph(value):
fig = go.Figure(go.Indicator(
mode = "number+delta",
value = fullmeanwage,
number = {'prefix': "£"},
delta = {'position': "top", 'reference': 320},
domain = {'x': [0, 1], 'y': [0, 1]}))
fig.update_layout(paper_bgcolor = "lightgray")
return fig
if __name__ == '__main__':
app.run_server(debug=True)
I am hoping this makes it a bit clearer as to what I was trying to do.
Thank you for your help