Incorporate a Plotly graph into a Shiny App

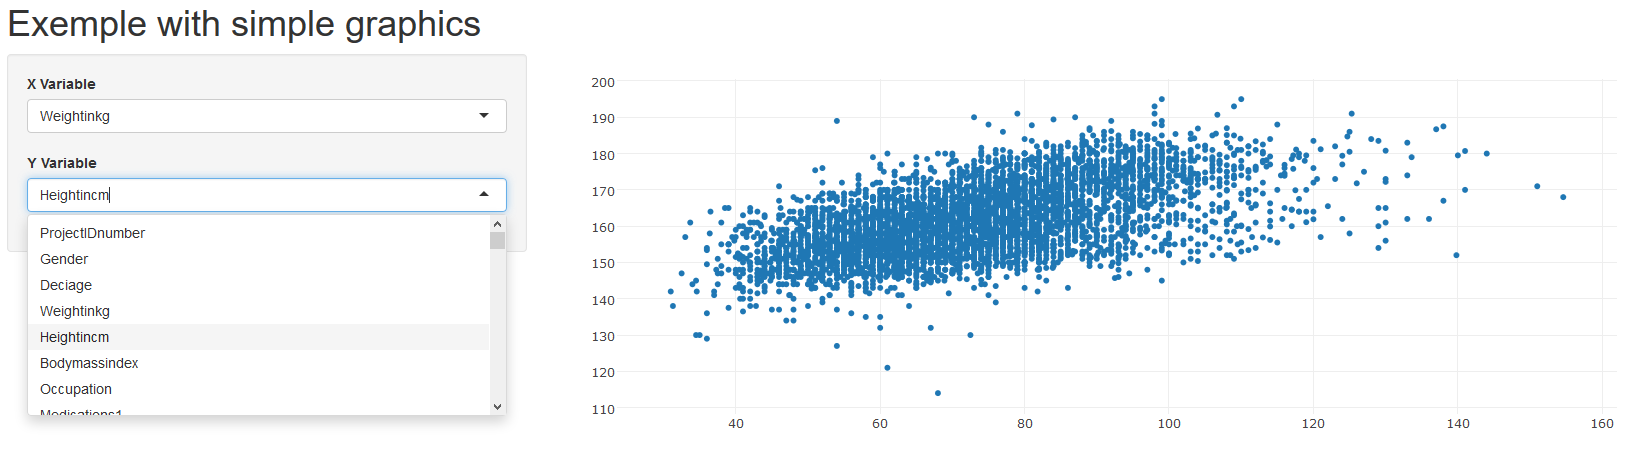
Hello everyone , i would like to have a Shiny application which could print an interactive graph (thanks to the package plotly on Rstudio) with the selection of the x and y parameters with this function : selectInput()
The data come from a database already import in Rstudio named table31.
Here is my code :

And What i obtain , an empty plotly graph :

What i expected : ( for that i just don’t use the selected input and put directly the column name in the ploty graph like table31$Weightincm etc…)

Hi @maxime.bordes

Maybe try something like this:

library(shiny)
library(plotly)

ui <- fluidPage(
  headerPanel('Example'),
  sidebarPanel(
    selectInput('xcol','X Variable', names(mtcars)),
    selectInput('ycol','Y Variable', names(mtcars)),
    selected = names(mtcars)[[2]]),
  mainPanel(
    plotlyOutput('plot')
  )
)

server <- function(input, output) {
  
  x <- reactive({
    mtcars[,input$xcol]
  })
  
  y <- reactive({
    mtcars[,input$ycol]
  })
  
  
  output$plot <- renderPlotly(
    plot1 <- plot_ly(
      x = x(),
      y = y(), 
      type = 'scatter',
      mode = 'markers')
  )

}

shinyApp(ui,server)