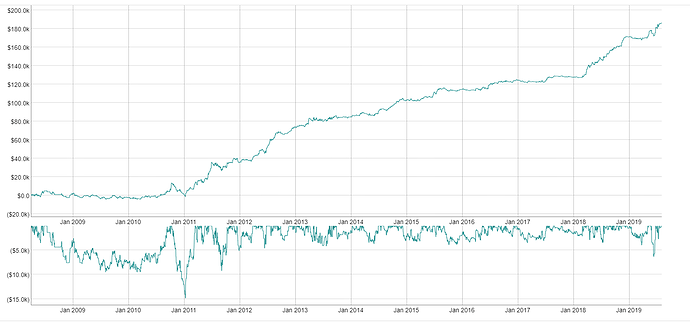
I’m currently transitioning from dygraph to plotly.
I have 2 graphs: one displays a time serie with a very wide range, the other one displays the drawdown of that time serie (so it’s always going to be at or below zero). It safe to assume x-axis data will be the same accross the 2 series. I control the size of the 2 charts with CSS height and let dygraph do the rest with automatic range.
Now I’m trying to do the same thing in plotly where, as I understand, it’s more convenient to use subplots to achieve something like this.
What I’m trying to achieve is separate and arbitrary Y-axis scaling for the 2 series, without having to provide max/min ranges. I’d like to only say “drawdown Y should be n-units in height and aggregated should be n-units”.
Simply putting the 2 series in the same charts won’t cut it since they need different scaling.
So, I’ve created a subplot Y-axis:
How can I now resize this new Y-axis to an arbitrary size (say, 1/3 of the other Y axis) and make it start from the same 0 as the other, similar as in my first picture?
If this is not possible and I need a separate chart, can I make it so that if I zoom one the other one zooms as well?
Here’s the plotly I’m working on: https://plot.ly/~Saturnix/4/
EDIT: I think I’ve managed to do it! See upated link


