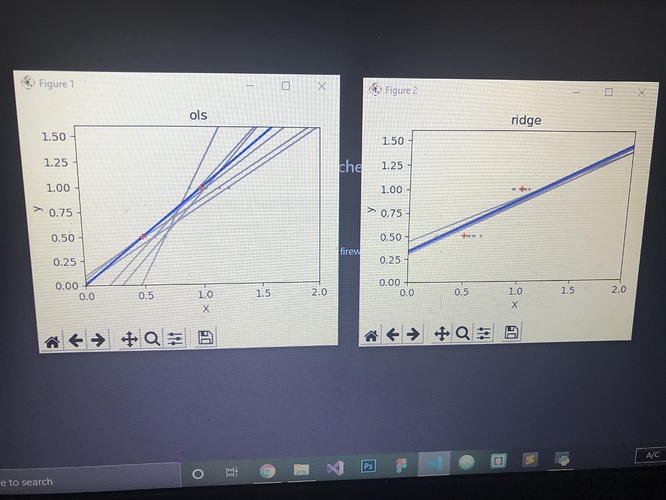
Here the code in sklearn and I want this plot in DC.graphs I tries different methods of traces but it didn’t worked
Code is available here: https://scikit-learn.org/stable/auto_examples/linear_model/plot_ols_ridge_variance.html#sphx-glr-auto-examples-linear-model-plot-ols-ridge-variance-py
Plz help me out with this from matplotlibrary to dash
I am stuck in a project need assistance!!help plz
