Hello  , I am currently working on a project, part of which is a monitoring system. To put it simply, I have a dataframe of fixed size, some values in which change every few milliseconds. The information stored in this dataframe can be visualized with a heatmap. I would like to make a jupyter-Dash app which would monitor the values of the dataframe and dynamically update the heatmap every 500 milliseconds (or 1 second).
The most important thing for me is the stability of such an App.
The code (in several implementations) is given below 
import plotly.graph_objects as go
import numpy as np
import pandas as pd
from jupyter_dash import JupyterDash
import dash_core_components as dcc
import dash_html_components as html
from dash.dependencies import Input, Output, State

# Simpler version
app = JupyterDash(__name__)
app.layout = html.Div(
    [
        dcc.Graph(id="heatmap"),
        dcc.Interval(id="animateInterval", interval=3000),
    ],
)

@app.callback(
    Output("heatmap", "figure"),
    Input("animateInterval", "n_intervals"),
)
# get_result func returns a df, that consists of 3 columns: currents, frequencies, response
def doUpdate(i):
    traces = list()
    resp = data.get_result().response.values
    xx = data.get_result().currents.values
    yy = data.get_result().frequencies.values

    traces.append(go.Heatmap(z=resp,
                             x=xx,
                             y=yy,
                             colorscale='RdBu'))
    return {'data': traces}
#2nd version
df = data.get_result()
fig = go.Figure(data=go.Heatmap(z=df.response,
                                x=df.currents,
                                y=df.frequencies))

# Build App
app = JupyterDash(__name__)
app.layout = html.Div(
    [
        dcc.Graph(id="heatmap", figure=fig),
        dcc.Interval(id="animateInterval", interval=1000, n_intervals=0),
    ],
)

@app.callback(
    Output("heatmap", "figure"),
    Input("animateInterval", "n_intervals"),
    State("heatmap", "figure")
)
def doUpdate(i, fig):
    global df
    df = data.get_result()

    return go.Figure(fig).update_traces(go.Heatmap(z=df.response,
                                x=df.currents,
                                y=df.frequencies))
However I ran into a problem:(. The thing is that such a dataframe can have a length of several millions of elements (and maybe even more than 10 millions). I would agree if the graph was updated, say, once a minute, but even so the application just can’t cope with such a load and crashes.
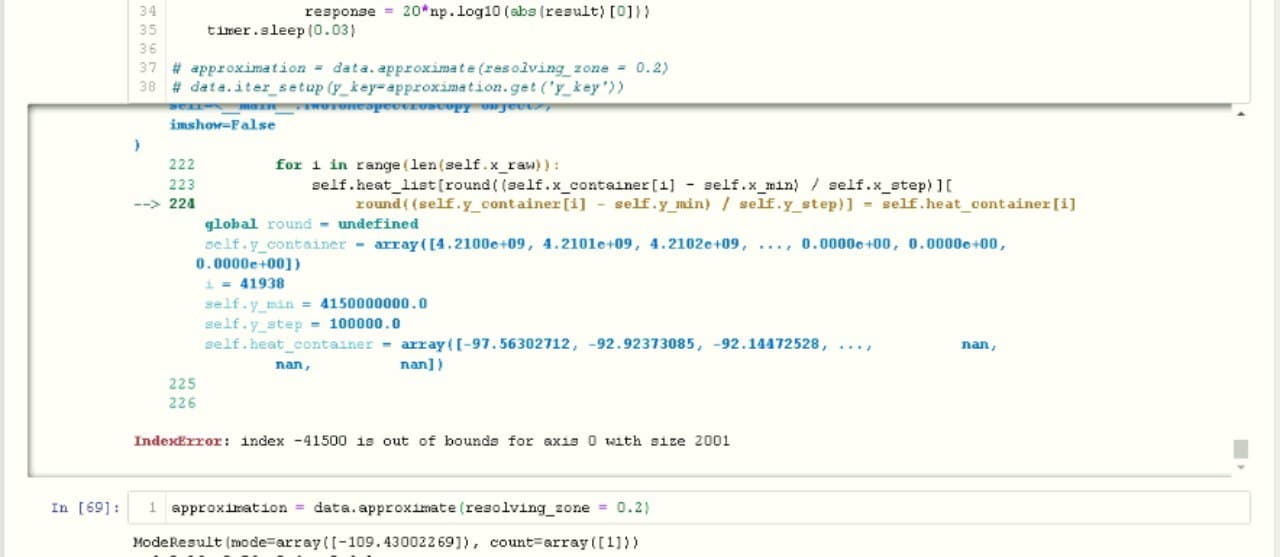
An IndexError appears, which refers to my main code in which the values in the dataframe are updated. Despite this error from Dash, my code continues to work fine (thanks multiprocessing!).

Even if you just output a static plotly heatmap using go.Heatmap(z=df.response, x=df.currents, y=df.frequencies), it will take quite a while to load.
SO
How should I change my code so that dash is most reliable in these calculations? maybe I need to try something else for this task? I’ve seen that dash is capable of handling quite complex data and calculations, so it seems to me that it should be able to handle this as well, maybe I’m doing something wrong?
Either way, I’d really like to see your opinion on this
THANKS!

