How to specific order x_axis/y_axis instead of alphabetical order of heatmap in plotly 4.5.2?
Hi,
I had the same issue, and solved it based on this post
stackoverflow r-plotly-cannot-re-arrange-x-axis-when-axis-type-is-category
You could use categoryorder and categoryarray to set the order of xaxis or yaxis.
Example:
m <- matrix(rnorm(12), nrow = 4, ncol = 3)
xlab = list(categoryorder = “array”, categoryarray = c(“a”, “b”, “c”,“d”))
ylab = list(categoryorder = “array”, categoryarray = c(“d”, “f”, “z”,“g”))
plot_ly(x = c(“a1”, “b1”, “c1”,“d1”), y = c(“d”, “f”, “z”,“g”), z = m, type = “heatmap”) %>%
layout(xaxis = xlab, yaxis = ylab)
Hi Yuting,
The first all, thank you very much for your help. But I can’t fix because type of value of x_axis is date but I convert to string, so order of plotly is alphabet. Below is my code:
library(plotly)

# Generate data
x_date <- c("2016-09-28","2016-09-29","2016-09-30","2016-10-01","2016-10-02")
y_users <- rnorm(5)
data <- data.frame(x_date, y_users)

data$x_date <- format(as.Date(data$x_date), "%b %d")

# Show chart
plot_ly(data = data,
        x = ~ x_date
  ) %>%
  add_lines(y = ~ y_users)
And my result, x_axis not order by ascending of value date:
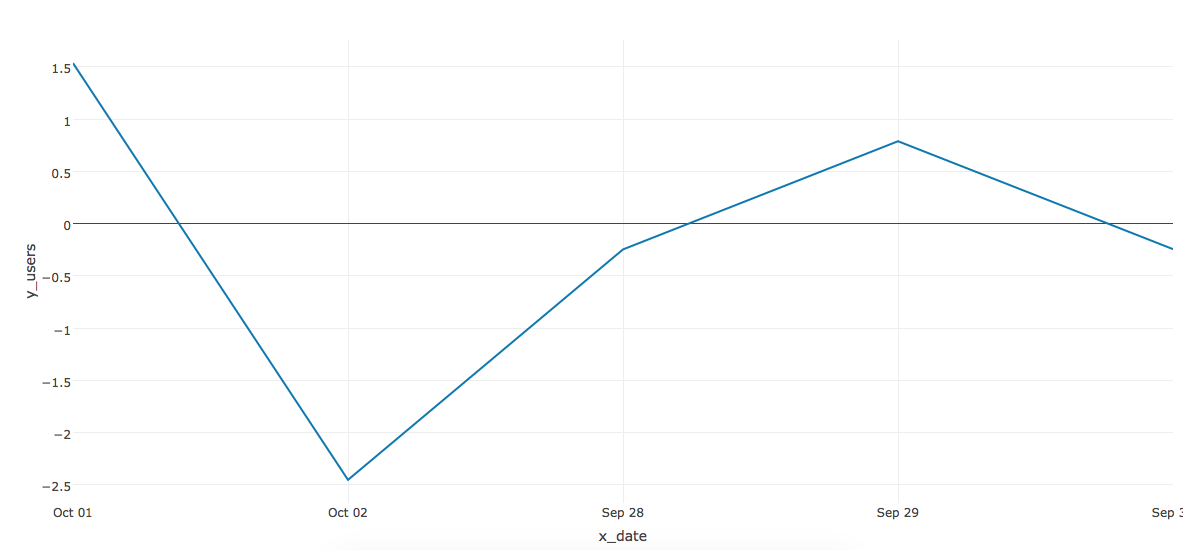
Please help me!