Hi guys
How can I set up notations, on x, y axis as well as a title in a pandas df.scatter_matrix.
scatter_matrix is generated ok however I would like to add text info as in matplotlit.

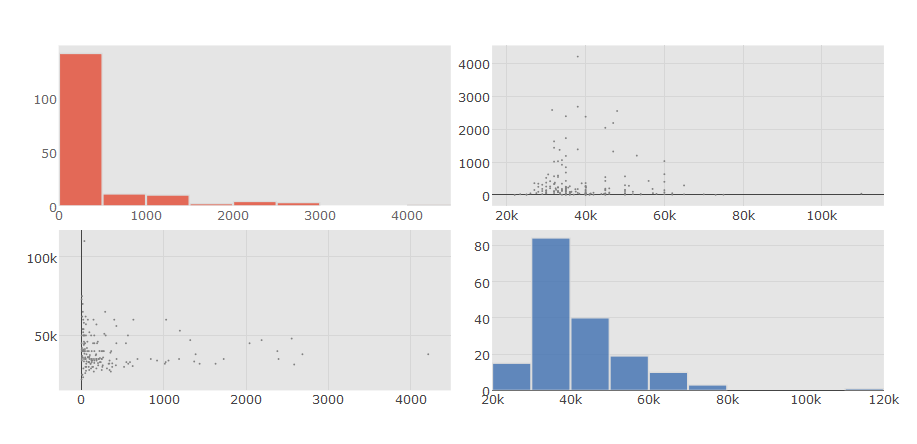
This creates the following plot
However I would like to have something similar to matplotlib:

Please advise,
Cheers