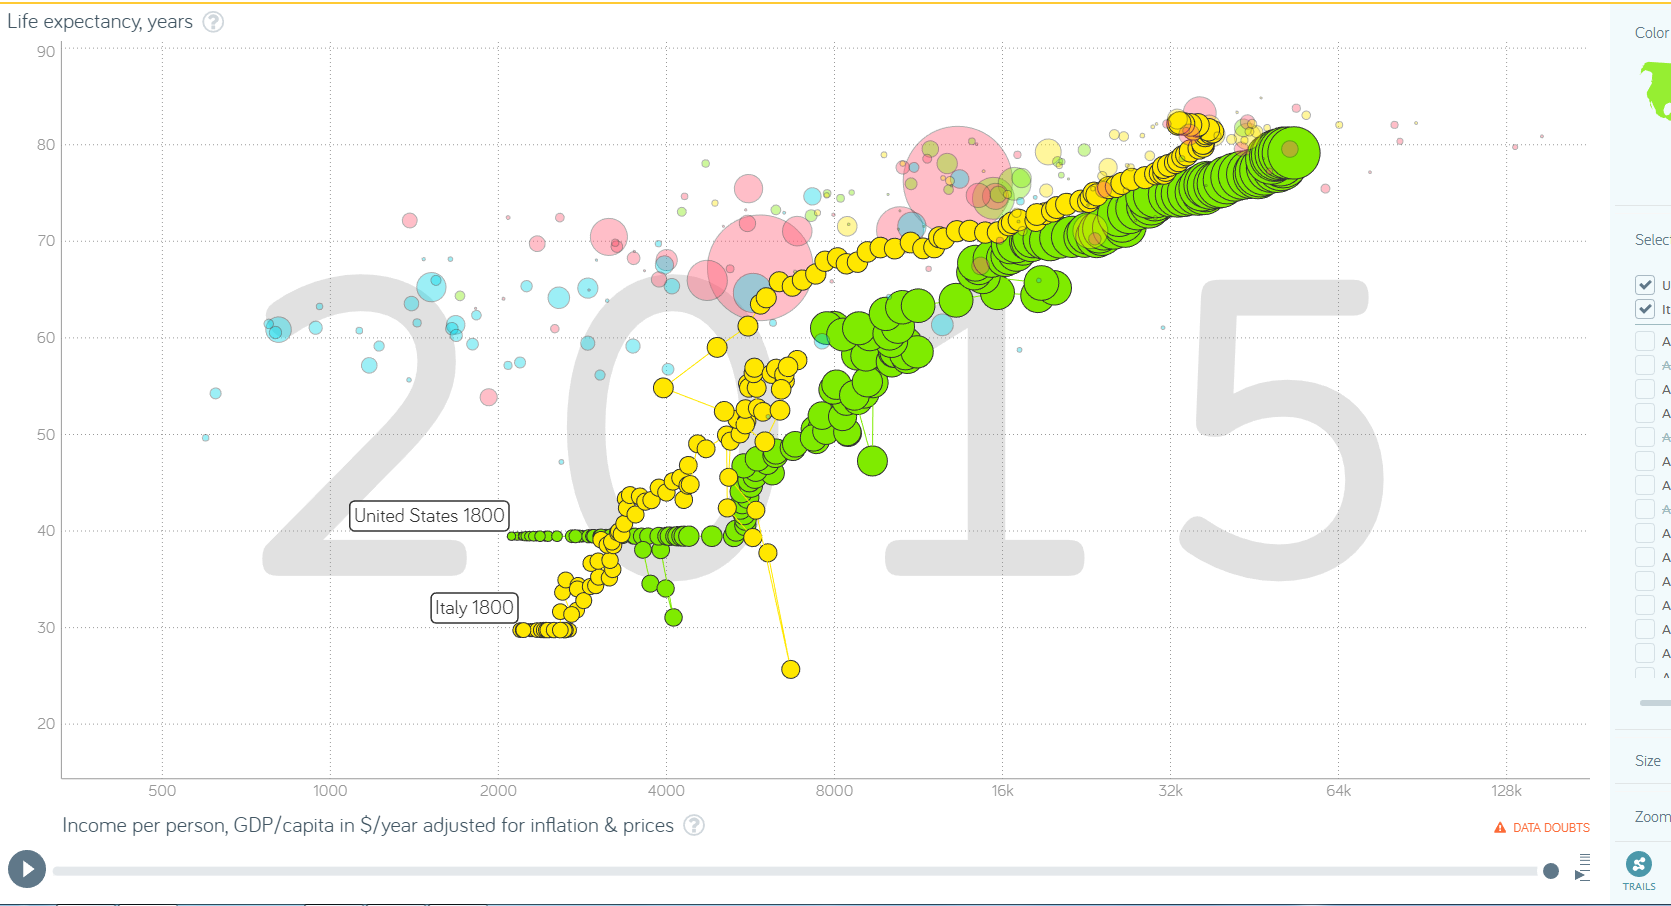
I am developing a time animated scatter plot application similar to the famous gapminder/vizabi example.
They provide the option, to toggle trails, meaning that the bubbles of previous timepoints are rendered in the current timeframe, giving an idea of how the bubble moved by producing a trail.
Does anyone know how to produce something similar with plotly.js?
I am using the scattergl plot and would like to switch on/off this behaviour for selected points/groups of points individually.
I’d really appreciate your help.
Thanks a lot and have a lovely day,
Lisa
Hi there,
I thought, I’ll give it a try again
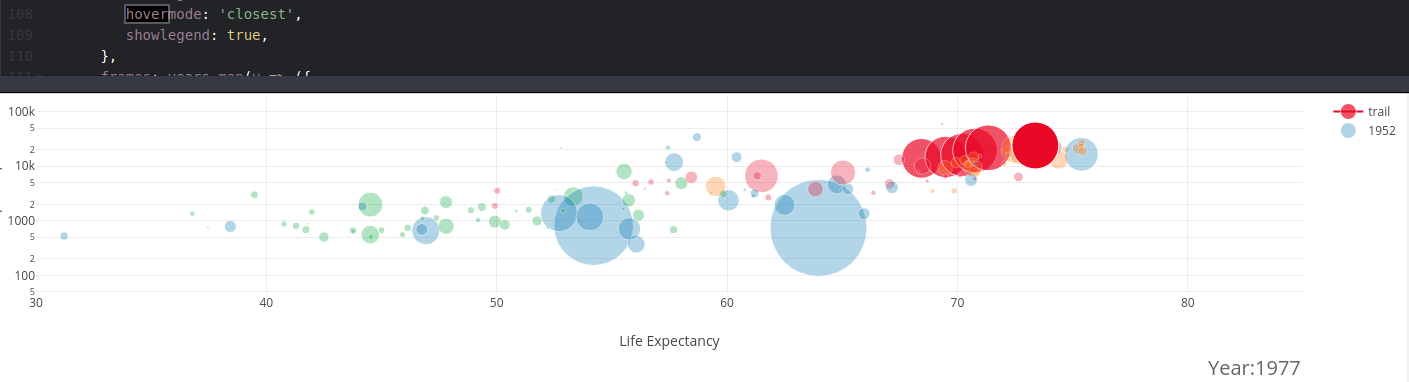
I already explained what I am trying to achieve and added a screenshot below to show you what I mean.
Are there any ideas on how to do achieve something like the ‘trails’ option of gapminder? (I read this this example, doing something similar in plotly.)
I wanted to avoid having to add all the previous data points to the current frame, as I wouldn’t know how to maintain correspondance of the points.
Is something similar to fading out of previous frames implemented or possible with plotly? Or how would you solve this task?
I would really appreciate your advice.
Best regards,
Lisa
Awesome. That’s super nice and pretty much what I was looking for. Thanks a lot @etienne.
What I didn’t get though was the .slice(0, i+i) in following line, guess that was just a typo, right? f.data[0]['marker.size'] = markerSize.slice(0, i + i)
Not a typo. Each data array is sliced such that their length match the number of sample passed. For example, frames[2] shows three data points corresponding to year 1952, 1957 and 1962, frames[3] has data for years 1952, 1957, 1962 and 1967 and so on.
This behavior is questionable. Perhaps you want to show the all sample points for a given after click? If so, a simple slice() should suffice.
Yes, that’s how I understood it for the x and y data arrays. but for markerSize you use .slice(i+i) not .slice(i+1)…and I was wondering if this was desired.