Due to needing access to the counts (y-axis) values, I’m currently plotting my histograms by first using numpy.histogram() and then calling go.Bar(). This is actually working out better than I thought in terms of speed. However, I would still like to have the plot carry the histogram style as much as possible instead of a plot of bars next to one another with no gap. Is there already a method (e.g. default layout) that I can use to update the plot at the end and make it look like a histogram?
Hello @henrybilliot52 welcome to the forums.
I don’t think that there is a default layout, how do you want it to look like?
Hi @AIMPED,
Thank you for replying! If possible, I would like to be able to make the histograms look like this
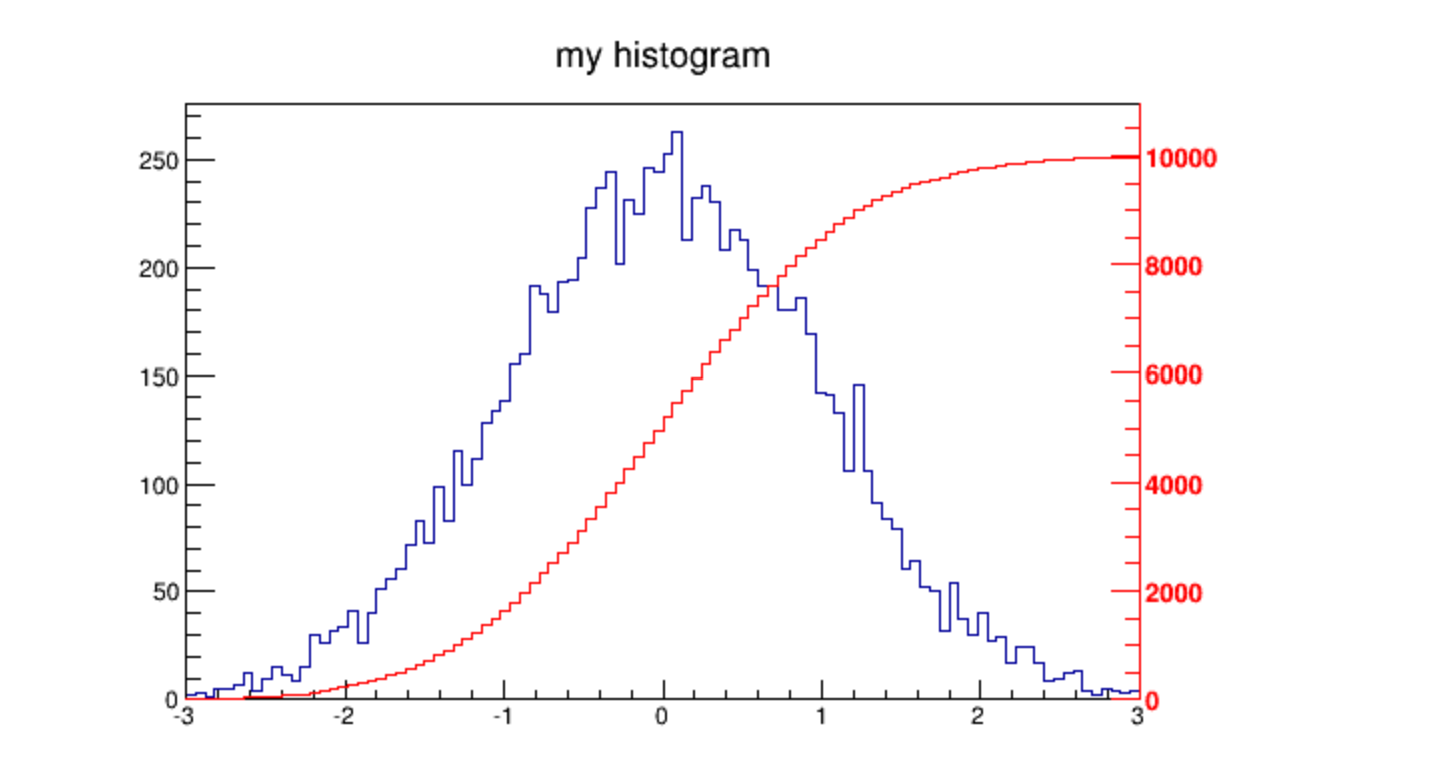
where there is no fill in each bar and only the top outline is drawn. So far, I have gotten the bar chart to look like this
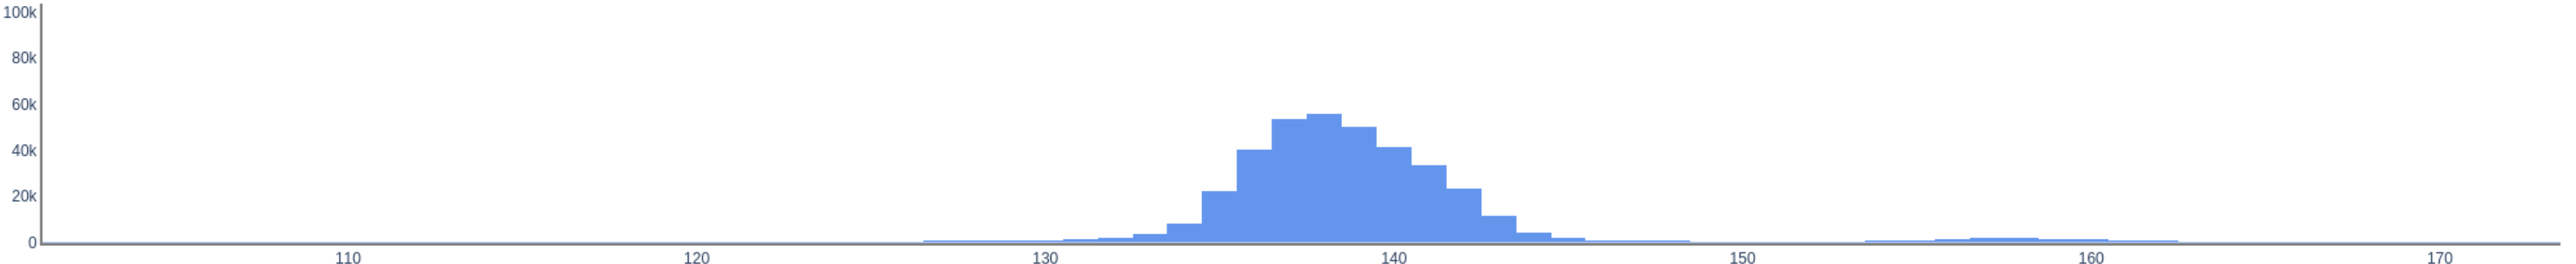
by setting marker_line=dict(width=0) and bargap=0.0. Do you know if it’s possible to add more settings and have the bar chart look like the picture I have above?
Hm, you could create a series of points from your y- values and plot them as line…
EDIT:
I had some time to play around:
import numpy as np
import plotly.express as px

# set number of bins and widht (>=2) of "colums"
BINS = 20
WIDTH = 5

# create data
np.random.seed(42)
hist, bins = np.histogram(np.random.standard_normal(10000), bins=BINS)

# create y- coordinates of points
y = np.asarray([[i] * WIDTH for i in hist])
y = y.flatten()

# create x- coordinates of points
x_base = np.arange(WIDTH)
x = np.asarray([x_base + i*(WIDTH - 1) for i in range(BINS)])
x = x.flatten()

# create figure
fig = px.line(x=x, y=y)
fig.update_layout(height=500, width=500, xaxis_range=[0, 90])
which creates:

That looks great!! Thank you so much!
Sorry to necro this, but for future folks looking for an answer to this, there’s an easier trick.
@AIMPED’s solution was a helpful first pass for me, but I found line plots are powerful enough without the extra work.
If you have the x-axis midpoints and the y-values of the bars, you don’t have to faff about with duplicating the height for each edge of the bins. You can just pass the x-axis midpoints and y-values to px.line(), and pass the line_shape parameter as 'hvh'.
import plotly.express as px

# if you only have the bin edges, and not the midpoints, you can calculate them
# assuming it's a numpy array
midpoints = 0.5 * (bin_edges[:-1] + bin_edges[1:])

fig = px.line(x=midpoints, y=bar_heights, line_shape="hvh")
fig.show()
The result looks identical to the @AIMPED’s solution, but requires less fiddling, and has an added bonus in its hover behaviour. @AIMPED’s solution gives a plot with 4 points per bar, none of which are centred so hovering gives 4 identical y values for these x-values. The solution I’ve shared would simply put one point right in the centre of each bar, and the hover would therefore not show multiple skewed values for x and y.
Hope this saves some folks a little time! ![]()