ay <- list(
tickfont = list(color = “black”),
overlaying = “y”,
side = “right”,
title = “Precipitation (mm)”,
titlefont=list(color=“black”)
)
ay2 <- list(
tickfont = list(color = “black”),
side = “left”,
title = “Water level (cm)”,
titlefont=list(color=“black”),
range=c(-5,12)
)
peat_surface<-list(yref = ‘paper’, xref = “paper”, y = 0.3, x=0.20,text = “peat surface”)
plot_ly() %>%
add_lines(x = PD_full$timestamp, y = ~PD_full$PD_RWL_cm, name = “Water level (cm)”, yaxis = “y1”, color=I(‘cadetblue4’)) %>%
add_bars(x = PD_full$timestamp, y = ~PD_full$Rain_mm_Tot_mm, name = “Precipitation (mm)”, yaxis = “y2”, color=I(“cornflowerblue”)) %>%
layout(
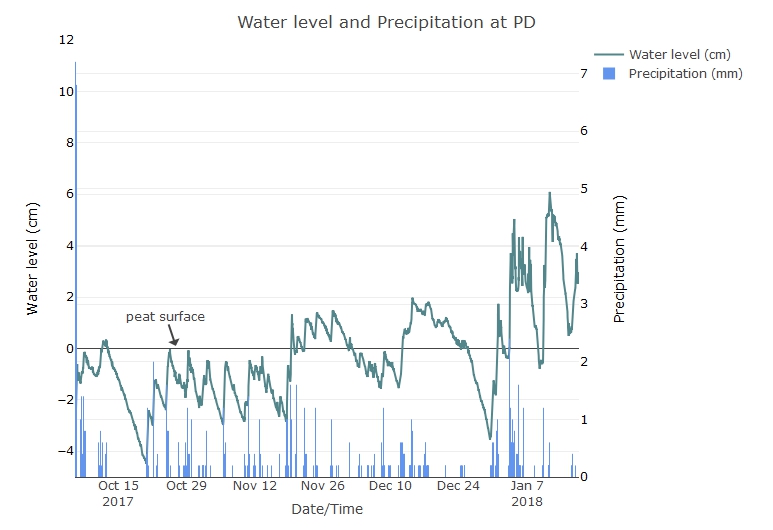
title = “Water level and Precipitation at PD”, yaxis2 = ay, yaxis = ay2,
xaxis = list(title=“Date/Time”),annotations= list(peat_surface)
)
#This is the code I used to generate a dual axis plot: precipitation on one y-axis and water level on another y-axis, with x-axis showing the date/time. However, I would like to make the precipitation bargraph start from the top (i.e. upside down). Any help on this matter will be highly appreciated.