How to label only states with count > number

Hiya. Can I filter which scattergeo text labels show based on criteria ‘count’ count column is greater than or equal to a value for example 34.

Alternately, can I pass a specific list of ‘state_code’ abbreviations to label?

I want only the states with the highest counts to be labeled with their counts, in other words hide the count labels on states except California, Texas, New York.

# make a minimal dataframe
data = [['CA', 42], ['NY', 41], ['TX', 34], ['FL', 31], ['PA', 26]]
 
dfdemo_map = pd.DataFrame(data, columns=['State_code', 'count'])

# plot a choropleth with color range by count per state
fig = px.choropleth(dfdemo_map,
                    locations='State_code',
                    locationmode="USA-states",
                    scope="usa",
                    color='count',
                    color_continuous_scale="Oranges",
                   )
# center the title
fig.update_layout(title_text='How Many Survey Respondents from each State', title_x=0.5)
# label states with count
fig.add_scattergeo(
    locations=dfdemo_map['State_code'],
    locationmode="USA-states",
    text = dfdemo_map['count'],
    featureidkey="properties.NAME_3",
    mode = 'text',
    textfont=dict(
            family="helvetica",
            size=24,
            color="white"
    )) 
fig.show()

my map currently looks like this.
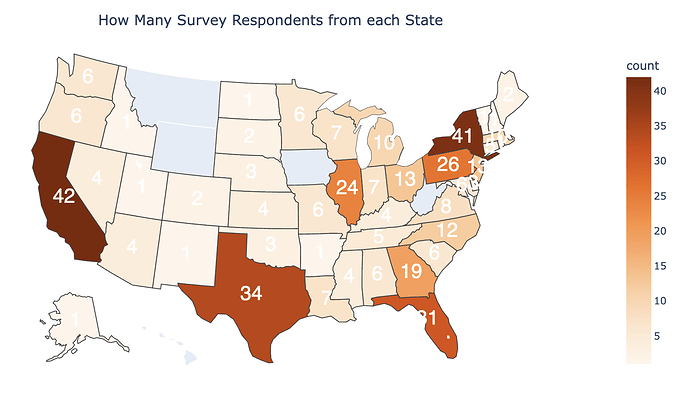
I don’t see any way to limit the data in the scattergeo map, so I can update the data directly after creating the graph.

new_texts = [state+':'+str(cnt) for state,cnt in zip(dfdemo_map['State_code'][:3], dfdemo_map['count'][:3])]
fig.data[1]['text'] = new_texts
fig.data[1]['locations'] = ['CA', 'NY', 'TX']

1 Like

@r-beginners I still want to show the choropleth colors on all the states however. The speciifc numerical labels I only want to show on the states with the largest counts. This looks like it hides the colors for everything else, but maybe I can overlay that on top to double up those few states?

One way to do it might be by adding a new column.

In this column, the values will remain as is if they are greater than X otherwise np.nan

dfdemo_map['count_cond'] = [x if x > 34 else np.nan for x in dfdemo_map['count']]
fig.add_scattergeo(
    ...
    text = dfdemo_map['count_cond'], # <---------
    featureidkey="properties.NAME_3",
    ...

Just tried it with your code, seems to work:

Hope this is what you were looking for.

1 Like

The image is limited to the states since you are using data provided by you. If you want to show the maximum count, that would be the method @eliasdabbas is suggesting.

2 Likes

@eliasdabbas great idea thank you! I sometimes forget to try a solution by changing the data I’m plotting. :slight_smile:

1 Like

Thank you again, this definitely a good alternative I’ll keep in mind!

@kmhurchla Glad it worked :slight_smile: