Is it possible to use add_scattergeo to add text labels to a map created with px.choropleth_map() (not px.choropleth()?

I would like to add text labels to a tiled map that was originally created within px.choropleth_map(). Here’s a simple set of code that I hoped would add two labels to a map of the US:

import plotly.express as px
fig_tiled_cm = px.choropleth_map(map_style='open-street-map', zoom=3, 
    center={'lat':37.9, 'lon':-96}).update_layout(margin = {
                    "r":0,"t":0,"l":0,"b":0})
# This update_layout() call was taken from
# https://plotly.com/python/map-configuration/ .

fig_tiled_cm.add_scattergeo(text = 
                             ['Test_1',
                             'Test_2'],
                             mode = 'text',
                             lat = [40, 45],
                             lon = [-100, -90])
fig_tiled_cm

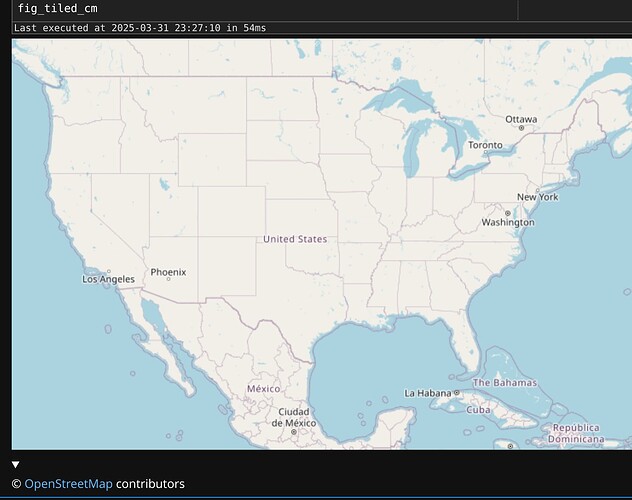
However, no labels are present within the output:

In contrast, if I run a similar set of code via px.choropleth(), the labels appear as expected:

fig_tileless_cm = px.choropleth(scope = 'usa')
fig_tileless_cm.add_scattergeo(text = 
                             ['Test_1',
                             'Test_2'],
                             mode = 'text',
                             lat = [40, 45],
                             lon = [-100, -90])
fig_tileless_cm

Is there a modification that I need to make to my first set of code to allow the labels to appear? Or is it not yet possible to add text labels to px.choropleth_map()-generated maps via add_scattergeo()?
Using scattermap on a graph object, you can add text to a tiled map.

fig_tiled_cm.add_trace(go.Scattermap(text = ['Test_1', 'Test_2'],
                                     mode = 'text',
                                     lat = [40, 45],
                                     lon = [-100, -90]))
fig_tiled_cm

1 Like

Thank you so much! This is a huge help!

By the way, this might be common knowledge already (and is mentioned in the documentation), but it looks like labels must be formatted as strings in order to show up within Scattermaps. I had been trying (and failing) to add floats as labels, but they weren’t appearing; converting them to strings resolved my issue.

Also, adding hoverinfo='skip' can help prevent these labels from interfering with users’ ability to view the choropleth regions’ underlying tooltips.