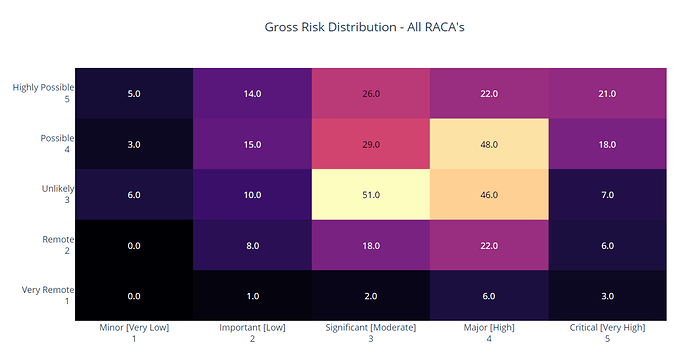
This is going to be really noddy but can someone point me to how i format the displayed numbers in a figure factory annotated heatmap.
I have it all working the last thing is to get the floats that are currently displaying to display as ints
Here is the code, I’m just running it in jupyter just now to test
# Create our temp dataframe df and pull in the data we are interested in.
# We also use this opertunity to remove blank entries
df = raca_df[['risk_id', 'gross_impact','gross_likelihood', 'business_unit', 'net_impact', 'net_likelihood']].dropna()

for item in ['gross_impact','gross_likelihood','net_impact', 'net_likelihood']:
    df[item] = df[item].astype('int')

# get our counts of the number of impact,likelihood pair
counts = df.groupby(['gross_impact','gross_likelihood']).apply(len).reset_index().values

heatmap = np.zeros((np.max(5), np.max(5)))

heatmap[counts[:,1]-1, counts[:,0]-1] = counts[:,2]

# Set up my Axis labels
x=['Minor [Very Low]<br>1', 'Important [Low]<br>2', 'Significant [Moderate]<br>3', 'Major [High]<br>4', 'Critical [Very High]<br>5']
y=['Very Remote<br>1', 'Remote<br>2', 'Unlikely<br>3', 'Possible<br>4', 'Highly Possible<br>5']

# import plotly.figure_factory as ff
fig = ff.create_annotated_heatmap(heatmap, x=x, y=y, colorscale='magma')

# Set the axes lables from the bottom. Eases readability
fig['layout']['xaxis']['side'] = 'bottom'

fig.layout.update({'title': "Gross Risk Distribution - All RACA's"}, title_x=0.5)

# display our Annotation
fig.show()
and if I check my dataframe info I can see the input is set to int
<class 'pandas.core.frame.DataFrame'>
Int64Index: 387 entries, 0 to 1157
Data columns (total 6 columns):
 #   Column            Non-Null Count  Dtype
---  ------            --------------  -----
 0   risk_id           387 non-null    category
 1   gross_impact      387 non-null    int32
 2   gross_likelihood  387 non-null    int32
 3   business_unit     387 non-null    category
 4   net_impact        387 non-null    int32
 5   net_likelihood    387 non-null    int32
dtypes: category(2), int32(4)
memory usage: 22.5 KB
Thanks for your help
