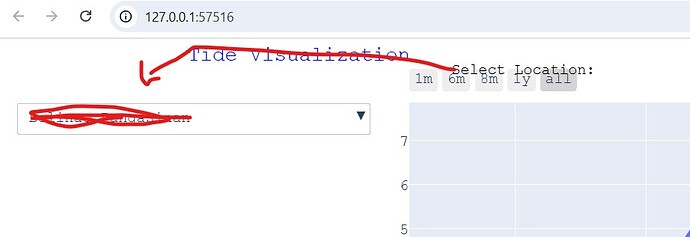
whenever i adjust the position of “Select location:” title to the top of dropdown menu, its not working, i’m beginner on plotly.
code:
import pandas as pd
import plotly.express as px
Load CSV file
df = pd.read_csv(‘output_file.csv’)
Labels
fig = px.scatter(df, x=‘datetime’, y=[‘observed_tide’, ‘estimated_tide’, ‘deviation’],
color=‘variable’, labels={‘variable’: ‘legend’, ‘datetime’: ‘Date/Time’})
Titles, Labels, and Size
fig.update_layout(
title=‘Tide Visualization’,
font=dict(size=16),
font_family=“Courier New”,
title_font_color=“blue”,
legend_title_font_color=“red”,
width=1500,
height=750,
title_y=1.0,
title_x=0.13,
)
Add Dropdown with Title
fig.update_layout(
annotations=[
dict(
text=“Select Location:”, # Dropdown title
x=0.050, # Adjust position
y=1.1, # Adjust position above the dropdown
xref=“paper”,
yref=“paper”,
showarrow=False,
font=dict(size=16, color=“black”),
)
],
updatemenus=[
dict(
buttons=[
dict(args=[“type”, “scatter”], label=“Bolinao Pangasinan”, method=“restyle”),
dict(args=[“type”, “bar”], label=“Corregidor Island Cavite”, method=“restyle”),
dict(args=[“type”, “scatter”], label=“Lubang Island Occidental Mindoro”, method=“restyle”),
dict(args=[“type”, “scatter”], label=“Subic Zambales”, method=“restyle”),
dict(args=[“type”, “scatter”], label=“Bislig Surigao Del Sur”, method=“restyle”),
dict(args=[“type”, “scatter”], label=“Jose Panganiban Camarines Norte”, method=“restyle”),
dict(args=[“type”, “scatter”], label=“Glan, Sarangani”, method=“restyle”),
dict(args=[“type”, “scatter”], label=“Anini-y, Antique”, method=“restyle”),
dict(args=[“type”, “scatter”], label=“Guiuan Eastern Samar”, method=“restyle”),
dict(args=[“type”, “scatter”], label=“Prieto Diaz Sorsogon”, method=“restyle”),
dict(args=[“type”, “scatter”], label=“Basco Batanes”, method=“restyle”),
dict(args=[“type”, “scatter”], label=“Abra de Ilog Occidental Mindoro”, method=“restyle”),
dict(args=[“type”, “scatter”], label=“Borongan Eastern Samar”, method=“restyle”),
dict(args=[“type”, “scatter”], label=“Culasi Antique”, method=“restyle”),
dict(args=[“type”, “scatter”], label=“Hinatuan-Bislig Bay Surigao del Sur”, method=“restyle”),
dict(args=[“type”, “scatter”], label=“Zamboanga”, method=“restyle”),
dict(args=[“type”, “scatter”], label=“Maasim Sarangani”, method=“restyle”),
dict(args=[“type”, “scatter”], label=“Sipalay Negors Occidental”, method=“restyle”),
dict(args=[“type”, “scatter”], label=“Dapa Surigao Del Norte”, method=“restyle”),
],
)
]
)
Add Time Range Selector
fig.update_layout(
xaxis=dict(
rangeselector=dict(
buttons=[
dict(count=1, label=“1m”, step=“month”, stepmode=“backward”),
dict(count=6, label=“6m”, step=“month”, stepmode=“backward”),
dict(count=8, label=“8m”, step=“year”, stepmode=“todate”),
dict(count=1, label=“1y”, step=“year”, stepmode=“backward”),
dict(step=“all”)
]
),
rangeslider=dict(visible=True)
)
)
Show Figure
fig.show()
data(for reference)
