Hi @jonjacson welcome to the forum! Would the following code work for you?
fig = px.bar(df, x=px.Constant('col'), y=['col1', 'col2'], animation_frame='Dates')
fig.update_layout(barmode='group')
fig.show()
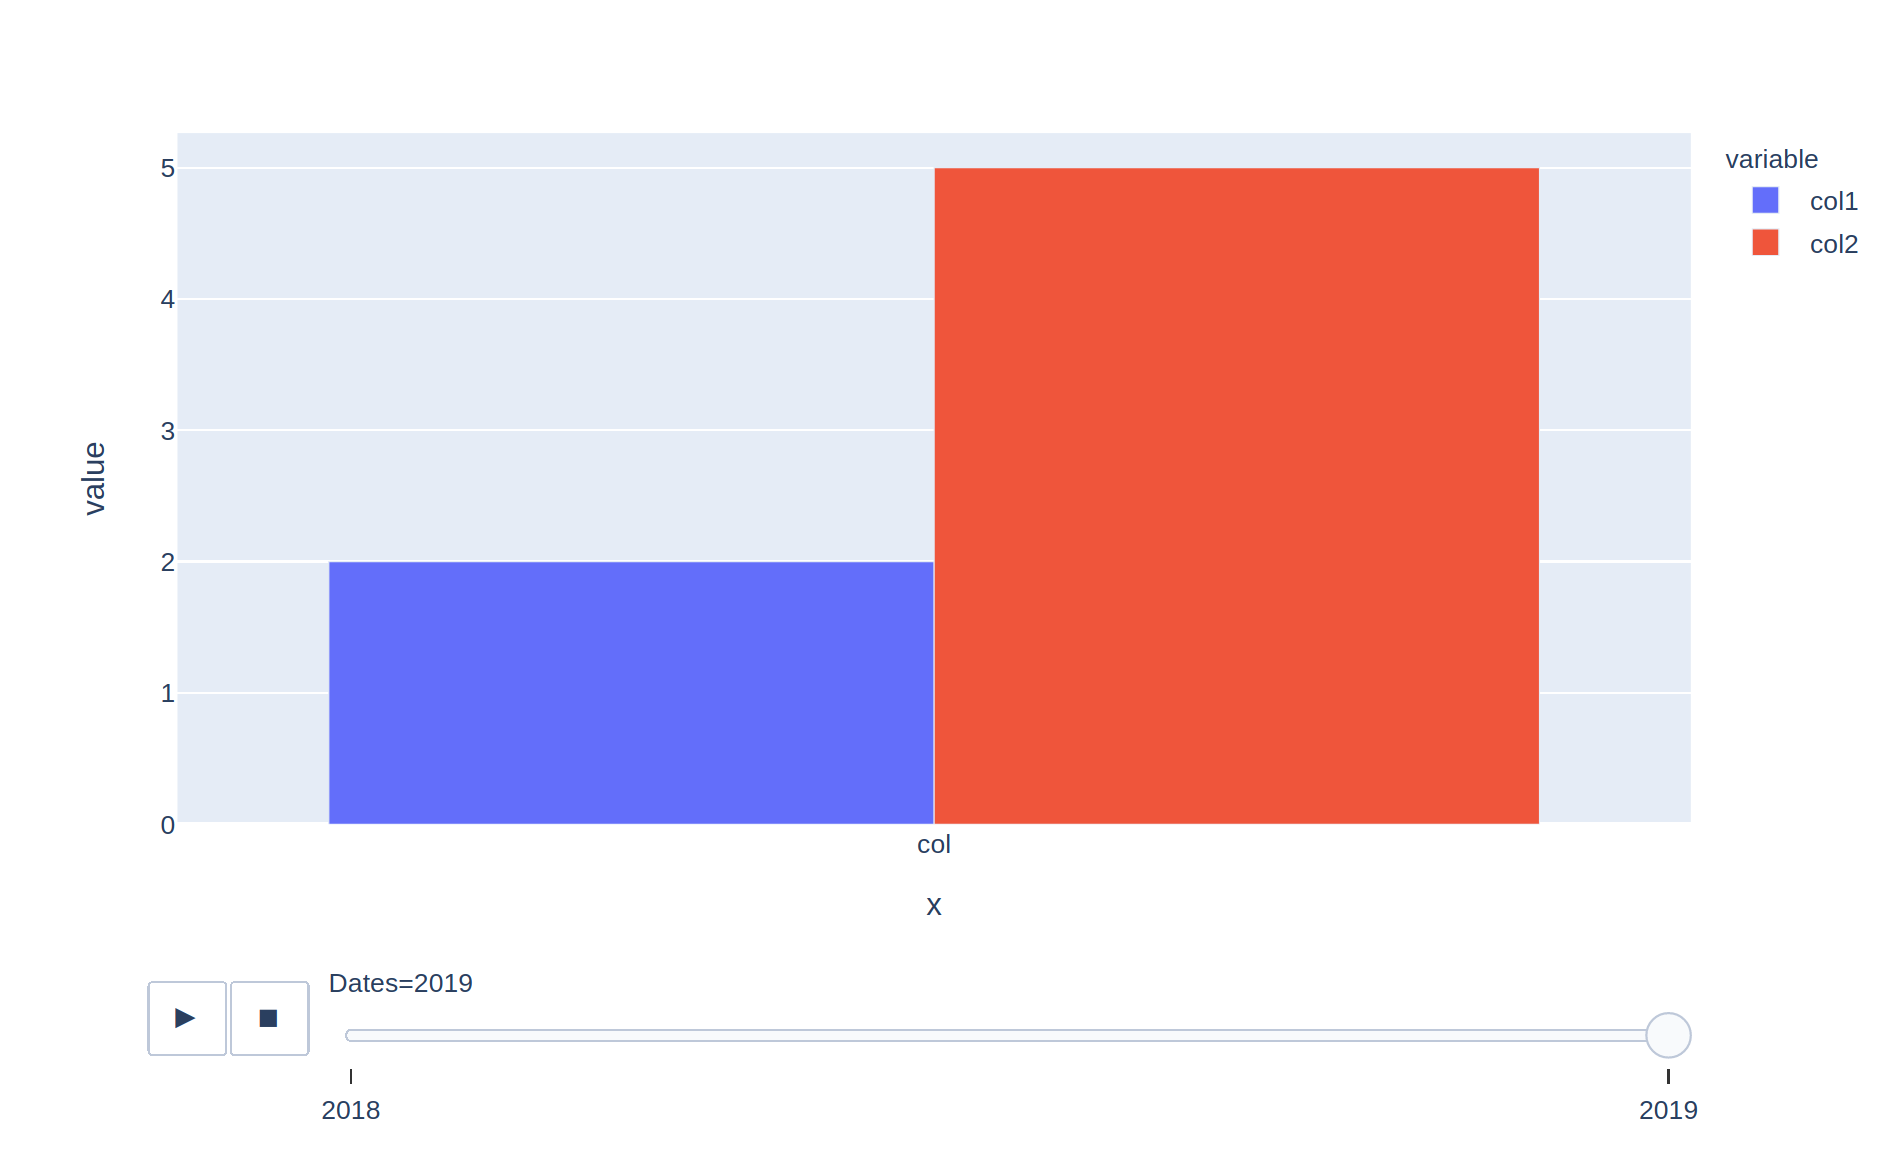
You have to give the column values in the
y argument, but if you don’t pass an x value then the index ([0, 1]) will be used. This is the reason why you had the impression that the bars “disappeared”, it’s because in the first frame they are displayed at position x=0 and in the second one at x=1 (which is not in the displayed range, you would need to zoom out to see it).