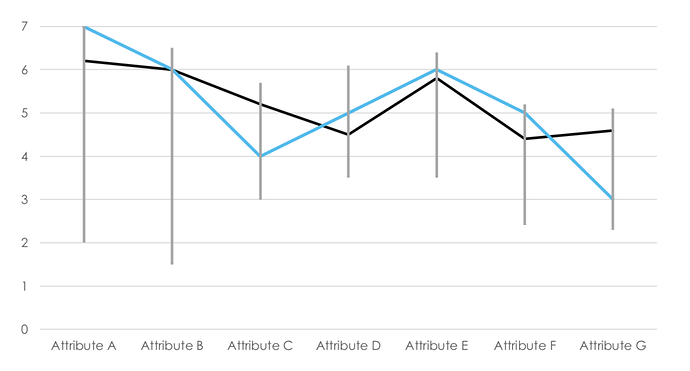
I’m new to plot.ly and trying to create a chart like following
Is there a specific name for chart like this?
Thanks.
Update:
trace = go.Bar(
    x=["Attribute A", "Attribute B", "Attribute C", "Attribute D", "Attribute E", "Attribute F", "Attribute G"],
    y=[5, 5, 2.5, 3, 3, 2.8, 2.5],
    base=[2, 1.5, 3, 3.5, 3.5, 2.5, 2.5],
    width=0.02
)

data = [trace]

figure = go.Figure(data=data)
figure.update_yaxes(range=[0, 7])

figure.add_trace(go.Scatter(
    x=["Attribute A", "Attribute B", "Attribute C", "Attribute D", "Attribute E", "Attribute F", "Attribute G"],
    y=[7, 6, 4, 5, 6, 5, 3],
    mode='lines',
    name='lines')
)

figure.add_trace(go.Scatter(
    x=["Attribute A", "Attribute B", "Attribute C", "Attribute D", "Attribute E", "Attribute F", "Attribute G"],
    y=[6.2, 6, 5.2, 4.5, 5.8, 4.4, 4.6],
    mode='lines',
    name='lines')
)

figure.show()
This is the code I came up with. Maybe using box plots a better idea?
