Hello, just wanted to understand how to combine/merge different Y axis data into one, for example I have 3 plots with different stock prices aside of the chart
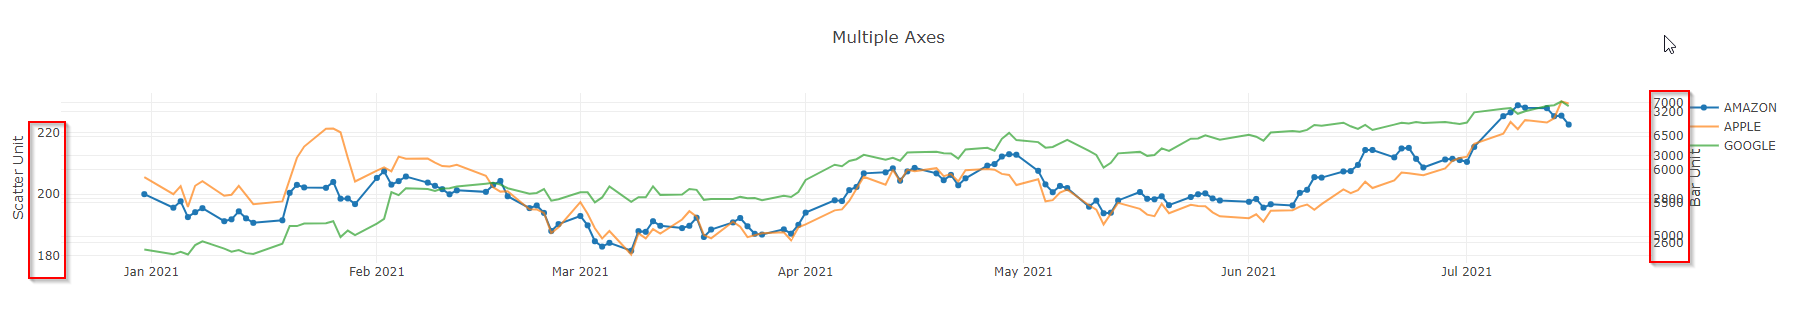
but how can combine these prices to make chart look like this?

I’m using plotly.net but I’m familiar with python so any help will be useful…
