i m trying to add newline inside dash datatable but failed with with these ways.
1/ markdown presentation desn’t allow user input.
2/ input presentation with css doesn’t change the typed \n to newline, with the preline css.
3/ pressing Enter in presentation doesnt create newline.
may i know is there some ways to create newline in datatable? thanks
2 Likes
hi @testingl
Try this post answer .
2 Likes
stu
March 18, 2022, 12:43am
3
hi Adam, I’m afraid he’s trying just to get his users to enter line breaks on the page.
hi @AnnMarieW May I ask if there is any way to type newlines by keyboard or copy and paste?
1 Like
thanks Adam and stu. Yep i m trying to let user input newlines inside a datatable cell. Sorry for not being clear.
Hey @testingl
Well, you can wrap overflow content onto multiple lines – and you can find some examples of how to do that in the docs , but I don’t think the user can enter a new line character to break the line at a specified place while entering data in the cell. It operates like an html.Input - and it’s not possible to enter new lines into an Input field like that.
The only workaround I can think of is to use using Textarea, which does support multi-line input. However, then you would have to create an html Table rather than using DataTable because you currently can’t use other components in DataTable cells.
thanks @jordan48 , could u provide a small sample plz. I dont quite understand it
thx very much @AnnMarieW . The user doesnt want to create another spearate table though. If something like embeded component could work would be great.
plotly:master ← plotly:sub-renderer
opened 05:05AM - 17 Oct 17 UTC
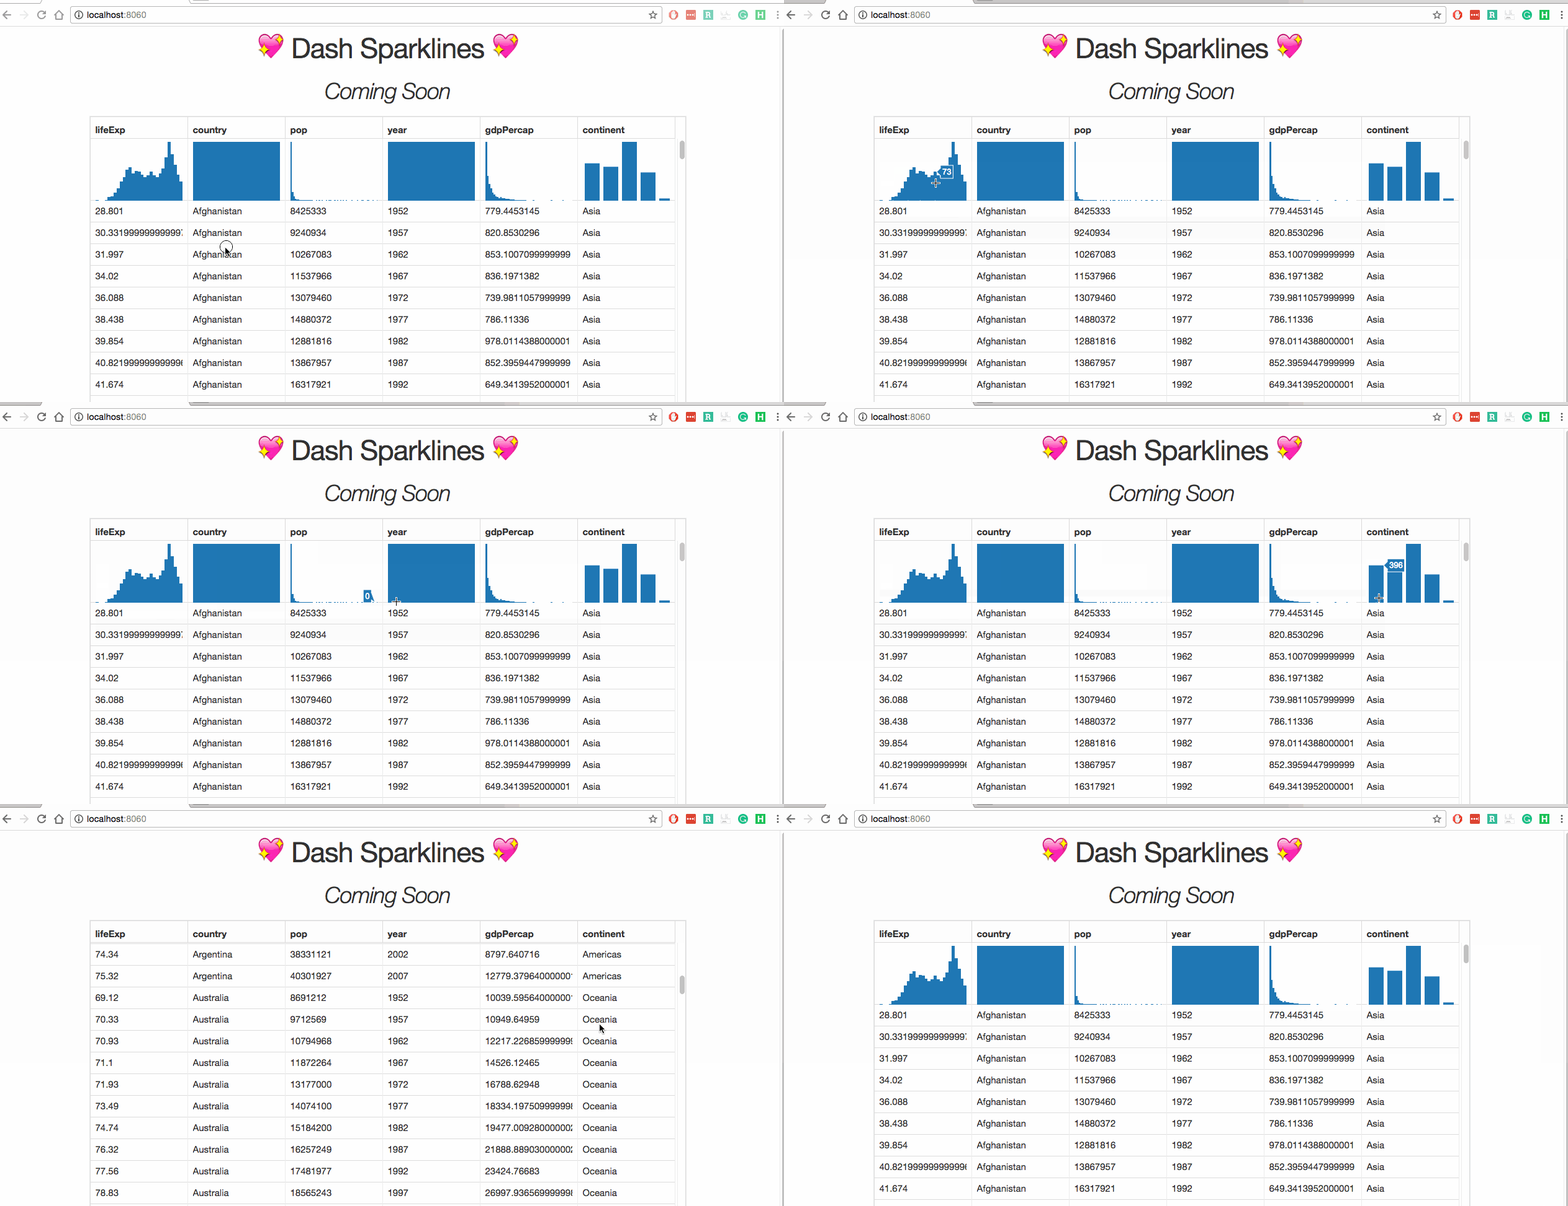
render anything inside cells: links, graphs, dropdowns, whatever!
enabled by ht… tps://github.com/plotly/dash-renderer/pull/26
would fix #6 and #7
usage (requires https://github.com/plotly/dash-renderer/pull/26)
```python
# -*- coding: UTF-8 -*-
import dash
from dash.dependencies import Input, Output, State
import dash_core_components as dcc
import dash_html_components as html
import dash_table_experiments as dt
import json
import pandas as pd
import plotly
app = dash.Dash()
app.scripts.config.serve_locally = True
DF_GAPMINDER = pd.read_csv(
'https://raw.githubusercontent.com/plotly/datasets/master/gapminderDataFiveYear.csv'
)
sparklines = {
c: html.Div(style={'height': 100, 'width': '100%'}, children=dcc.Graph(
id=c,
figure={
'data': [{
'x': DF_GAPMINDER[c],
'type': 'histogram'
}],
'layout': {
'height': 100,
'width': 150,
'margin': {
'l': 0, 'r': 0, 't': 0, 'b': 0
},
'xaxis': {
'showticklabels': False,
'showline': False,
'showgrid': False,
},
'yaxis': {
'showticklabels': False,
'showline': False,
'showgrid': False,
}
}
},
config={'displayModeBar': False}
))
for c in DF_GAPMINDER.columns
}
app.layout = html.Div([
html.H1('💖 Dash Sparklines 💖', style={'textAlign': 'center'}),
html.H2(html.I('Coming Soon'), style={'textAlign': 'center'}),
dt.DataTable(
rows=[sparklines] + DF_GAPMINDER.to_dict('records'),
id='table',
min_height=1500,
),
html.Div(dcc.Dropdown(), style={'display': 'none'})
], className="container")
app.css.append_css({
"external_url": "https://codepen.io/chriddyp/pen/bWLwgP.css"
})
if __name__ == '__main__':
app.run_server(debug=True, port=8060)
```

The datatable is great job btw.
1 Like