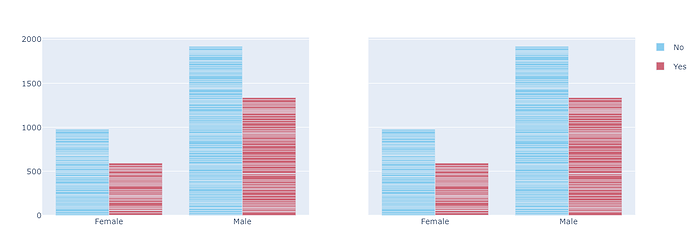
tips= px.data.tips()

fig = make_subplots(rows=1,cols=2,shared_yaxes=True)

bar1 = px.bar(tips, x="sex", y="total_bill",
             color='smoker',
             barmode ='group',title = 'Group')

bar2= px.bar(tips, x="sex", y="total_bill",
             color='smoker',
             barmode ='stack',title = 'Relative')

bar2.update_traces(showlegend=False)
fig.add_trace(bar1.data[0],row=1,col=1)
fig.add_trace(bar1.data[1],row=1,col=1)
fig.add_trace(bar2.data[0],row=1,col=2)
fig.add_trace(bar2.data[1],row=1,col=2)
Currently, I am doing a plotly tutorial and learning and reading with great interest.
The problem I’ve been through right now is…
I made a bar graph with a plotly express, one with a ‘group type’ and the other with a ‘stack type’. I want to subplot this, but there’s no way to express 'stacks '(‘overlay’ as well) and anyone have any advice here?
